Humana 2009 Annual Report Download - page 42
Download and view the complete annual report
Please find page 42 of the 2009 Humana annual report below. You can navigate through the pages in the report by either clicking on the pages listed below, or by using the keyword search tool below to find specific information within the annual report.-
 1
1 -
2
-
3
-
4
-
5
-
6
-
7
-
8
-
9
-
10
-
11
-
12
-
13
-
14
-
15
-
16
-
17
-
18
-
19
-
20
-
21
-
22
-
23
-
24
-
25
-
26
-
27
-
28
-
29
-
30
-
31
-
 32
32 -
 33
33 -
 34
34 -
 35
35 -
 36
36 -
 37
37 -
 38
38 -
 39
39 -
 40
40 -
 41
41 -
 42
42 -
 43
43 -
 44
44 -
 45
45 -
 46
46 -
 47
47 -
 48
48 -
 49
49 -
 50
50 -
 51
51 -
 52
52 -
53
-
54
-
55
-
56
-
57
-
58
-
59
-
60
-
61
-
62
-
63
-
64
-
65
-
66
-
67
-
68
-
69
-
70
-
71
-
72
-
73
-
74
-
75
-
76
-
77
-
78
-
79
-
80
-
81
-
82
-
83
-
84
-
85
-
86
-
87
-
88
-
89
-
90
-
91
-
92
-
93
-
94
-
95
-
96
-
97
-
98
-
99
-
100
-
101
-
102
-
103
-
104
-
105
-
106
-
107
-
108
-
109
-
110
-
111
-
112
-
113
-
114
-
115
-
116
-
117
-
118
-
119
-
120
-
121
-
122
-
123
-
124
-
125
-
126
-
127
-
128
-
129
-
130
-
131
-
132
-
133
-
134
-
135
-
136
-
137
-
138
-
139
-
140
 |
 |
d) Equity Compensation Plan
The information required by this part of Item 5 is incorporated herein by reference from our Proxy
Statement for the Annual Meeting of Stockholders scheduled to be held on April 20, 2010 appearing under the
caption “Equity Compensation Plan Information” of such Proxy Statement.
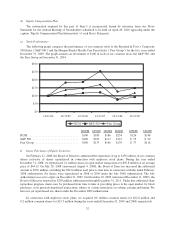
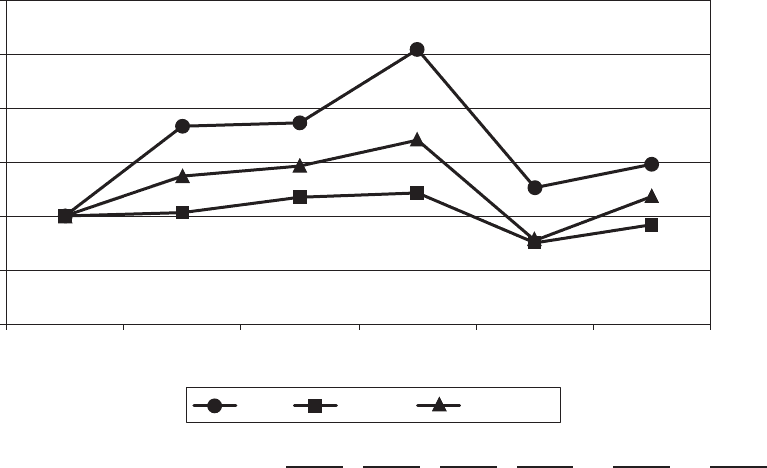
e) Stock Performance
The following graph compares the performance of our common stock to the Standard & Poor’s Composite
500 Index (“S&P 500”) and the Morgan Stanley Health Care Payer Index (“Peer Group”) for the five years ended
December 31, 2009. The graph assumes an investment of $100 in each of our common stock, the S&P 500, and
the Peer Group on December 31, 2004.
$0
$100
$50
$150
$250
$200
$300
12/31/04
HUM S&P 500 Peer Group
12/31/05 12/31/06 12/31/07 12/31/08 12/31/09
12/31/04 12/31/05 12/31/06 12/31/07 12/31/08 12/31/09
HUM .................................. $100 $183 $186 $254 $126 $148
S&P500 ............................... $100 $103 $117 $121 $ 75 $ 92
Peer Group ............................. $100 $137 $146 $170 $ 77 $118
f) Issuer Purchases of Equity Securities
On February 22, 2008, the Board of Directors authorized the repurchase of up to $150 million of our common
shares exclusive of shares repurchased in connection with employee stock plans. During the year ended
December 31, 2008, we repurchased 2.1 million shares in open market transactions for $92.8 million at an average
price of $44.19. On July 28, 2008 (announced August 4, 2008), the Board of Directors increased the authorized
amount to $250 million, excluding the $92.8 million used prior to that time in connection with the initial February
2008 authorization. No shares were repurchased in 2008 or 2009 under the July 2008 authorization. The July
authorization was set to expire on December 31, 2009. On December 10, 2009 (announced December 11, 2009), the
Board of Directors renewed its $250 million authorization through December 31, 2011. Under this authorized share
repurchase program, shares may be purchased from time to time at prevailing prices in the open market, by block
purchases, or in privately-negotiated transactions, subject to certain restrictions on volume, pricing and timing. We
have not yet repurchased any shares under the December 2009 authorization.
In connection with employee stock plans, we acquired 0.6 million common shares for $22.8 million and
0.2 million common shares for $13.3 million during the years ended December 31, 2009 and 2008, respectively.
32