Humana 2009 Annual Report Download - page 115
Download and view the complete annual report
Please find page 115 of the 2009 Humana annual report below. You can navigate through the pages in the report by either clicking on the pages listed below, or by using the keyword search tool below to find specific information within the annual report.-
 1
1 -
2
-
3
-
4
-
5
-
6
-
7
-
8
-
9
-
10
-
11
-
12
-
13
-
14
-
15
-
16
-
17
-
18
-
19
-
20
-
21
-
22
-
23
-
24
-
25
-
26
-
27
-
28
-
29
-
30
-
31
-
32
-
33
-
34
-
35
-
36
-
37
-
38
-
39
-
40
-
41
-
42
-
43
-
44
-
45
-
46
-
47
-
48
-
49
-
50
-
51
-
52
-
53
-
54
-
55
-
56
-
57
-
58
-
59
-
60
-
61
-
62
-
63
-
64
-
65
-
66
-
67
-
68
-
69
-
70
-
71
-
72
-
73
-
74
-
75
-
76
-
77
-
78
-
79
-
80
-
81
-
82
-
83
-
84
-
85
-
86
-
87
-
88
-
89
-
90
-
91
-
92
-
93
-
94
-
95
-
96
-
97
-
98
-
99
-
100
-
101
-
102
-
103
-
104
-
 105
105 -
 106
106 -
 107
107 -
 108
108 -
 109
109 -
 110
110 -
 111
111 -
 112
112 -
 113
113 -
 114
114 -
 115
115 -
 116
116 -
 117
117 -
 118
118 -
 119
119 -
 120
120 -
 121
121 -
 122
122 -
 123
123 -
 124
124 -
 125
125 -
126
-
127
-
128
-
129
-
130
-
131
-
132
-
133
-
134
-
135
-
136
-
137
-
138
-
139
-
140
 |
 |

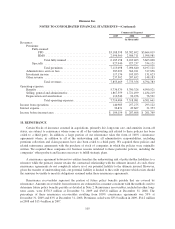
Humana Inc.
NOTES TO CONSOLIDATED FINANCIAL STATEMENTS—(Continued)
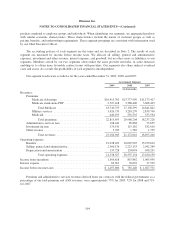
Commercial Segment
2009 2008 2007
(in thousands)
Revenues:
Premiums:
Fully-insured:
PPO .......................................... $3,188,598 $3,582,692 $3,664,019
HMO ......................................... 2,996,560 2,586,711 1,998,981
Total fully-insured ........................... 6,185,158 6,169,403 5,663,000
Specialty .......................................... 927,940 927,237 534,121
Total premiums ............................. 7,113,098 7,096,640 6,197,121
Administrative services fees ............................... 387,693 366,011 317,856
Investment income ...................................... 117,176 105,053 131,623
Other revenue .......................................... 237,502 207,652 148,183
Total revenues .............................. 7,855,469 7,775,356 6,794,783
Operating expenses:
Benefits ............................................... 5,736,579 5,700,326 4,990,921
Selling, general and administrative .......................... 1,867,359 1,721,499 1,434,219
Depreciation and amortization ............................. 110,546 96,256 76,521
Total operating expenses ...................... 7,714,484 7,518,081 6,501,661
Income from operations ...................................... 140,985 257,275 293,122
Interest expense ............................................. 36,831 49,667 31,353
Income before income taxes ................................... $ 104,154 $ 207,608 $ 261,769
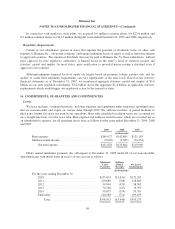
18. REINSURANCE
Certain blocks of insurance assumed in acquisitions, primarily life, long-term care, and annuities in run-off
status, are subject to reinsurance where some or all of the underwriting risk related to these policies has been
ceded to a third party. In addition, a large portion of our reinsurance takes the form of 100% coinsurance
agreements where, in addition to all of the underwriting risk, all administrative responsibilities, including
premium collections and claim payment, have also been ceded to a third party. We acquired these policies and
related reinsurance agreements with the purchase of stock of companies in which the policies were originally
written. We acquired these companies for business reasons unrelated to these particular policies, including the
companies’ other products and licenses necessary to fulfill strategic plans.
A reinsurance agreement between two entities transfers the underwriting risk of policyholder liabilities to a
reinsurer while the primary insurer retains the contractual relationship with the ultimate insured. As such, these
reinsurance agreements do not completely relieve us of our potential liability to the ultimate insured. However,
given the transfer of underwriting risk, our potential liability is limited to the credit exposure which exists should
the reinsurer be unable to meet its obligations assumed under these reinsurance agreements.
Reinsurance recoverables represent the portion of future policy benefits payable that are covered by
reinsurance. Amounts recoverable from reinsurers are estimated in a manner consistent with the methods used to
determine future policy benefits payable as detailed in Note 2. Reinsurance recoverables, included in other long-
term assets, were $378.3 million at December 31, 2009 and $365.8 million at December 31, 2008. The
percentage of these reinsurance recoverables resulting from 100% coinsurance agreements was 59% at
December 31, 2009 and 63% at December 31, 2008. Premiums ceded were $33.0 million in 2009, $34.2 million
in 2008 and $13.4 million in 2007.
105