Humana 2009 Annual Report Download - page 68
Download and view the complete annual report
Please find page 68 of the 2009 Humana annual report below. You can navigate through the pages in the report by either clicking on the pages listed below, or by using the keyword search tool below to find specific information within the annual report.-
 1
1 -
2
-
3
-
4
-
5
-
6
-
7
-
8
-
9
-
10
-
11
-
12
-
13
-
14
-
15
-
16
-
17
-
18
-
19
-
20
-
21
-
22
-
23
-
24
-
25
-
26
-
27
-
28
-
29
-
30
-
31
-
32
-
33
-
34
-
35
-
36
-
37
-
38
-
39
-
40
-
41
-
42
-
43
-
44
-
45
-
46
-
47
-
48
-
49
-
50
-
51
-
52
-
53
-
54
-
55
-
56
-
57
-
 58
58 -
 59
59 -
 60
60 -
 61
61 -
 62
62 -
 63
63 -
 64
64 -
 65
65 -
 66
66 -
 67
67 -
 68
68 -
 69
69 -
 70
70 -
 71
71 -
 72
72 -
 73
73 -
 74
74 -
 75
75 -
 76
76 -
 77
77 -
 78
78 -
79
-
80
-
81
-
82
-
83
-
84
-
85
-
86
-
87
-
88
-
89
-
90
-
91
-
92
-
93
-
94
-
95
-
96
-
97
-
98
-
99
-
100
-
101
-
102
-
103
-
104
-
105
-
106
-
107
-
108
-
109
-
110
-
111
-
112
-
113
-
114
-
115
-
116
-
117
-
118
-
119
-
120
-
121
-
122
-
123
-
124
-
125
-
126
-
127
-
128
-
129
-
130
-
131
-
132
-
133
-
134
-
135
-
136
-
137
-
138
-
139
-
140
 |
 |

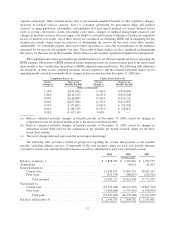
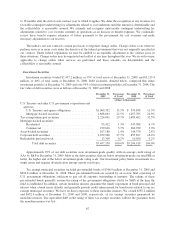
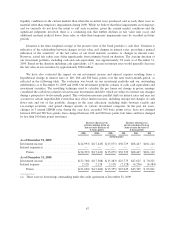
The following table summarizes the changes in estimate for incurred claims related to prior years
attributable to our key assumptions. As previously described, our key assumptions consist of trend and
completion factors estimated using an assumption of moderately adverse conditions. The amounts below
represent the difference between our original estimates and the actual benefit expenses ultimately incurred as
determined from subsequent claim payments.
Favorable Development by Changes in Key Assumptions
2009 2008 2007
Amount
Factor
Change (a) Amount
Factor
Change (a) Amount
Factor
Change (a)
(dollars in thousands)
Trend factors ..................... $(151,171) (3.5)% $(175,268) (5.2)% $(124,957) (4.3)%
Completion factors ................ (101,585) 0.8% (92,759) 1.0% (63,985) 0.8%
Medicare Part D reconciliation ....... — n/a — n/a (53,980) n/a
Total ....................... $(252,756) $(268,027) $(242,922)
(a) The factor change indicated represents the percentage point change.
As summarized in the table above, the majority of the favorable development resulted from trend factors for
the most recent three months ultimately being lower than originally estimated for each of the years presented.
Some of the more significant factors that drove the actual trend factors lower than the originally estimated trends
over the last three years include lower than originally estimated utilization of hospital and physician services for
both our Commercial and Medicare lines of business, as well as rapid growth in our Medicare Advantage and
Commercial high deductible products in new geographic areas which resulted in more limited historical
information from which to base trend rate estimates.
Additionally, actual completion factors ultimately were higher than our original completion factors used to
establish reserves at December 31, 2008, 2007, and 2006, which were based upon historical patterns. This
increase in completion factor percentage primarily resulted from a shortening of the cycle time associated with
provider claim submissions and improved claim recovery patterns associated with system and process changes.
Finally, first-year Medicare Part D enrollment and eligibility issues during 2006 led to actual claim
settlements with other health plans and various state governments during 2007 for amounts less than originally
estimated. Similar adjustments in 2009 and 2008 were not significant due to a lower volume of new enrollees and
subsequent improvements in the program’s enrollment process.
We continually adjust our historical trend and completion factor experience with our knowledge of recent
events that may impact current trends and completion factors when establishing our reserves. Because our
reserving practice is to consistently recognize the actuarial best point estimate using an assumption of moderately
adverse conditions as required by actuarial standards, there is a reasonable possibility that variances between
actual trend and completion factors and those assumed in our December 31, 2009 estimates would fall towards
the middle of the ranges previously presented in our sensitivity table, as has occurred in previous years.
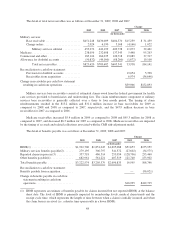
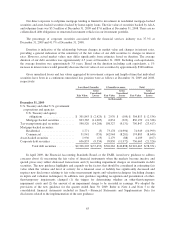
Benefit expenses associated with military services and provisions associated with future policy benefits
excluded from the previous table were as follows for the years ended December 31, 2009, 2008 and 2007:
2009 2008 2007
(in thousands)
Military services ................................. $3,019,655 $2,819,787 $2,481,814
Future policy benefits ............................. 73,130 64,338 16,392
Total ...................................... $3,092,785 $2,884,125 $2,498,206
58