Humana 2009 Annual Report Download - page 54
Download and view the complete annual report
Please find page 54 of the 2009 Humana annual report below. You can navigate through the pages in the report by either clicking on the pages listed below, or by using the keyword search tool below to find specific information within the annual report.-
 1
1 -
2
-
3
-
4
-
5
-
6
-
7
-
8
-
9
-
10
-
11
-
12
-
13
-
14
-
15
-
16
-
17
-
18
-
19
-
20
-
21
-
22
-
23
-
24
-
25
-
26
-
27
-
28
-
29
-
30
-
31
-
32
-
33
-
34
-
35
-
36
-
37
-
38
-
39
-
40
-
41
-
42
-
43
-
 44
44 -
 45
45 -
 46
46 -
 47
47 -
 48
48 -
 49
49 -
 50
50 -
 51
51 -
 52
52 -
 53
53 -
 54
54 -
 55
55 -
 56
56 -
 57
57 -
 58
58 -
 59
59 -
 60
60 -
 61
61 -
 62
62 -
 63
63 -
 64
64 -
65
-
66
-
67
-
68
-
69
-
70
-
71
-
72
-
73
-
74
-
75
-
76
-
77
-
78
-
79
-
80
-
81
-
82
-
83
-
84
-
85
-
86
-
87
-
88
-
89
-
90
-
91
-
92
-
93
-
94
-
95
-
96
-
97
-
98
-
99
-
100
-
101
-
102
-
103
-
104
-
105
-
106
-
107
-
108
-
109
-
110
-
111
-
112
-
113
-
114
-
115
-
116
-
117
-
118
-
119
-
120
-
121
-
122
-
123
-
124
-
125
-
126
-
127
-
128
-
129
-
130
-
131
-
132
-
133
-
134
-
135
-
136
-
137
-
138
-
139
-
140
 |
 |

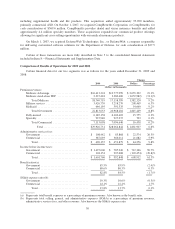
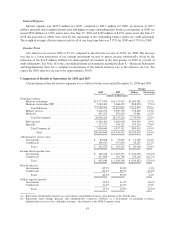
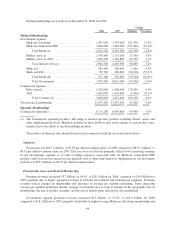
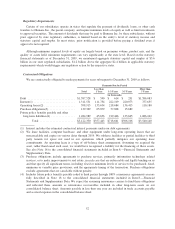
Ending membership was as follows at December 31, 2008 and 2007:
2008 2007
Change
Members Percentage
Medical Membership:
Government segment:
Medicare Advantage ........................... 1,435,900 1,143,000 292,900 25.6%
Medicare stand-alone PDP ....................... 3,066,600 3,442,000 (375,400) (10.9)%
Total Medicare ............................ 4,502,500 4,585,000 (82,500) (1.8)%
Military services .............................. 1,736,400 1,719,100 17,300 1.0%
Military services ASO .......................... 1,228,300 1,146,800 81,500 7.1%
Total military services ...................... 2,964,700 2,865,900 98,800 3.4%
Medicaid .................................... 385,400 384,400 1,000 0.3%
Medicaid ASO ................................ 85,700 180,600 (94,900) (52.5)%
Total Medicaid ............................ 471,100 565,000 (93,900) (16.6)%
Total Government ......................... 7,938,300 8,015,900 (77,600) (1.0)%
Commercial segment:
Fully-insured ................................. 1,978,800 1,808,600 170,200 9.4%
ASO ........................................ 1,642,000 1,643,000 (1,000) (0.1)%
Total Commercial ......................... 3,620,800 3,451,600 169,200 4.9%
Total medical membership .......................... 11,559,100 11,467,500 91,600 0.8%
Specialty Membership:
Commercial segment(a) ............................. 6,713,200 6,643,800 69,400 1.0%
(a) The Commercial segment provides a full range of insured specialty products including dental, vision, and
other supplemental products. Members included in these products may not be unique to each product since
members have the ability to enroll in multiple products.
These tables of financial data should be reviewed in connection with the discussion that follows.
Summary
Net income was $647.2 million, or $3.83 per diluted common share, in 2008 compared to $833.7 million, or
$4.91 per diluted common share, in 2007. The year-over-year decline primarily reflects lower operating earnings
in our Government segment as a result of higher expenses associated with our Medicare stand-alone PDP
products and lower net investment income primarily due to other-than-temporary impairments in our investment
portfolios of $65.3 million, or $0.39 per diluted common share.
Premium Revenues and Medical Membership
Premium revenues increased $3.7 billion, or 14.9%, to $28.1 billion for 2008, compared to $24.4 billion for
2007 primarily due to higher premium revenues in both the Government and Commercial segments. Premium
revenues reflect changes in membership and increases in average per member premiums. Items impacting
average per member premiums include changes in premium rates as well as changes in the geographic mix of
membership, the mix of product offerings, and the mix of benefit plans selected by our membership.
Government segment premium revenues increased $2.8 billion, or 15.0%, to $21.0 billion for 2008
compared to $18.2 billion for 2007 primarily attributable to higher average Medicare Advantage membership and
44