Humana 2009 Annual Report Download - page 99
Download and view the complete annual report
Please find page 99 of the 2009 Humana annual report below. You can navigate through the pages in the report by either clicking on the pages listed below, or by using the keyword search tool below to find specific information within the annual report.-
 1
1 -
2
-
3
-
4
-
5
-
6
-
7
-
8
-
9
-
10
-
11
-
12
-
13
-
14
-
15
-
16
-
17
-
18
-
19
-
20
-
21
-
22
-
23
-
24
-
25
-
26
-
27
-
28
-
29
-
30
-
31
-
32
-
33
-
34
-
35
-
36
-
37
-
38
-
39
-
40
-
41
-
42
-
43
-
44
-
45
-
46
-
47
-
48
-
49
-
50
-
51
-
52
-
53
-
54
-
55
-
56
-
57
-
58
-
59
-
60
-
61
-
62
-
63
-
64
-
65
-
66
-
67
-
68
-
69
-
70
-
71
-
72
-
73
-
74
-
75
-
76
-
77
-
78
-
79
-
80
-
81
-
82
-
83
-
84
-
85
-
86
-
87
-
88
-
 89
89 -
 90
90 -
 91
91 -
 92
92 -
 93
93 -
 94
94 -
 95
95 -
 96
96 -
 97
97 -
 98
98 -
 99
99 -
 100
100 -
 101
101 -
 102
102 -
 103
103 -
 104
104 -
 105
105 -
 106
106 -
 107
107 -
 108
108 -
 109
109 -
110
-
111
-
112
-
113
-
114
-
115
-
116
-
117
-
118
-
119
-
120
-
121
-
122
-
123
-
124
-
125
-
126
-
127
-
128
-
129
-
130
-
131
-
132
-
133
-
134
-
135
-
136
-
137
-
138
-
139
-
140
 |
 |

Humana Inc.
NOTES TO CONSOLIDATED FINANCIAL STATEMENTS—(Continued)
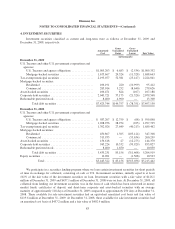
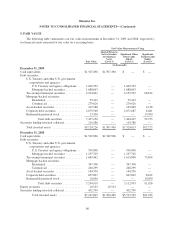
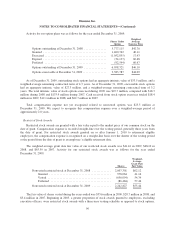
The following table presents details of our other intangible assets included in other long-term assets in the
accompanying consolidated balance sheets at December 31, 2009 and 2008:
Weighted
Average
Life
2009 2008
Cost
Accumulated
Amortization Net Cost
Accumulated
Amortization Net
(in thousands)
Other intangible assets:
Customer contracts ....... 11.2 yrs $314,885 $117,748 $197,137 $341,085 $86,288 $254,797
Provider contracts ....... 16.0 yrs 42,753 8,281 34,472 36,253 4,903 31,350
Trade names and other .... 11.7 yrs 16,986 5,127 11,859 22,486 7,345 15,141
Total other intangible
assets ........... 11.8 yrs $374,624 $131,156 $243,468 $399,824 $98,536 $301,288
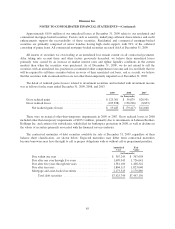
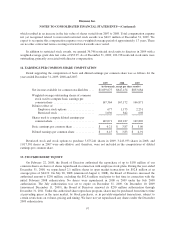
9. BENEFITS PAYABLE
Activity in benefits payable, excluding military services, was as follows for the years ended December 31,
2009, 2008 and 2007:
2009 2008 2007
(in thousands)
Balances at January 1 ........................ $ 2,898,782 $ 2,355,461 $ 1,979,733
Acquisitions ................................ — 96,021 41,029
Incurred related to:
Current year ............................ 21,934,973 21,092,135 18,015,247
Prior years ............................. (252,756) (268,027) (242,922)
Total incurred ...................... 21,682,217 20,824,108 17,772,325
Paid related to:
Current year ............................ (19,572,740) (18,579,247) (15,847,574)
Prior years ............................. (2,064,880) (1,797,561) (1,590,052)
Total paid .......................... (21,637,620) (20,376,808) (17,437,626)
Balances at December 31 ..................... $ 2,943,379 $ 2,898,782 $ 2,355,461
Amounts incurred related to prior years vary from previously estimated liabilities as the claims ultimately
are settled. Negative amounts reported for incurred related to prior years result from claims being ultimately
settled for amounts less than originally estimated (favorable development). The favorable development
experienced over the last three years primarily was attributable to lower than originally estimated utilization of
hospital and physician services for both our Commercial and Medicare lines of business, rapid growth in our
Medicare Advantage and Commercial high deductible products in new geographic areas which resulted in more
limited historical information from which to base trend rate estimates, as well as a shortening of the cycle time
associated with provider claim submissions and improved claim recovery patterns associated with system and
process changes. In addition, first-year Medicare Part D enrollment and eligibility issues during 2006 led to
actual claim settlements with other health plans and various state governments during 2007 for amounts less than
originally estimated. Similar adjustments in 2009 and 2008 were not significant due to a lower volume of new
enrollees and subsequent improvements in the program’s enrollment process.
89