Humana 2009 Annual Report Download - page 98
Download and view the complete annual report
Please find page 98 of the 2009 Humana annual report below. You can navigate through the pages in the report by either clicking on the pages listed below, or by using the keyword search tool below to find specific information within the annual report.-
 1
1 -
2
-
3
-
4
-
5
-
6
-
7
-
8
-
9
-
10
-
11
-
12
-
13
-
14
-
15
-
16
-
17
-
18
-
19
-
20
-
21
-
22
-
23
-
24
-
25
-
26
-
27
-
28
-
29
-
30
-
31
-
32
-
33
-
34
-
35
-
36
-
37
-
38
-
39
-
40
-
41
-
42
-
43
-
44
-
45
-
46
-
47
-
48
-
49
-
50
-
51
-
52
-
53
-
54
-
55
-
56
-
57
-
58
-
59
-
60
-
61
-
62
-
63
-
64
-
65
-
66
-
67
-
68
-
69
-
70
-
71
-
72
-
73
-
74
-
75
-
76
-
77
-
78
-
79
-
80
-
81
-
82
-
83
-
84
-
85
-
86
-
87
-
 88
88 -
 89
89 -
 90
90 -
 91
91 -
 92
92 -
 93
93 -
 94
94 -
 95
95 -
 96
96 -
 97
97 -
 98
98 -
 99
99 -
 100
100 -
 101
101 -
 102
102 -
 103
103 -
 104
104 -
 105
105 -
 106
106 -
 107
107 -
 108
108 -
109
-
110
-
111
-
112
-
113
-
114
-
115
-
116
-
117
-
118
-
119
-
120
-
121
-
122
-
123
-
124
-
125
-
126
-
127
-
128
-
129
-
130
-
131
-
132
-
133
-
134
-
135
-
136
-
137
-
138
-
139
-
140
 |
 |

Humana Inc.
NOTES TO CONSOLIDATED FINANCIAL STATEMENTS—(Continued)
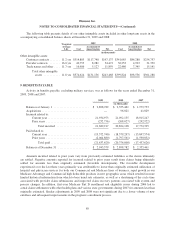
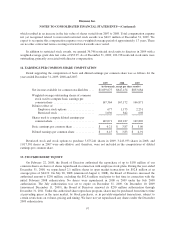
7. PROPERTY AND EQUIPMENT, NET
Property and equipment was comprised of the following at December 31, 2009 and 2008:
2009 2008
(in thousands)
Land ..................................................... $ 16,206 $ 16,206
Buildings .................................................. 368,341 360,655
Equipment and computer software .............................. 1,549,789 1,468,540
1,934,336 1,845,401
Accumulated depreciation .................................... (1,255,194) (1,133,909)
Property and equipment, net ............................... $ 679,142 $ 711,492
Depreciation expense was $213.0 million in 2009, $183.3 million in 2008, and $162.4 million in 2007.
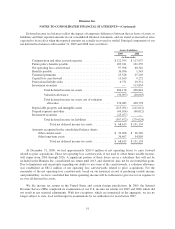
8. GOODWILL AND OTHER INTANGIBLE ASSETS
Changes in the carrying amount of goodwill, by segment, for the years ended December 31, 2009 and 2008
were as follows:
Commercial Government Total
(in thousands)
Balance at December 31, 2007 ................................. $1,118,323 $545,616 $1,663,939
Acquisitions and subsequent payments/adjustments ............. 150,576 148,596 299,172
Balance at December 31, 2008 ................................. 1,268,899 694,212 1,963,111
Acquisitions and subsequent payments/adjustments ............. 12,726 17,087 29,813
Balance at December 31, 2009 ................................. $1,281,625 $711,299 $1,992,924
Other intangible assets primarily relate to acquired customer contracts and are included with other long-term
assets in the consolidated balance sheets. Amortization expense for other intangible assets was approximately
$37.3 million in 2009, $37.1 million in 2008 and $22.4 million in 2007. The following table presents our estimate
of amortization expense for each of the five next succeeding fiscal years:
(in thousands)
For the years ending December 31,:
2010 ...................................................... $33,810
2011 ...................................................... 32,101
2012 ...................................................... 30,509
2013 ...................................................... 27,035
2014 ...................................................... 24,298
88