Humana 2009 Annual Report Download - page 47
Download and view the complete annual report
Please find page 47 of the 2009 Humana annual report below. You can navigate through the pages in the report by either clicking on the pages listed below, or by using the keyword search tool below to find specific information within the annual report.-
 1
1 -
2
-
3
-
4
-
5
-
6
-
7
-
8
-
9
-
10
-
11
-
12
-
13
-
14
-
15
-
16
-
17
-
18
-
19
-
20
-
21
-
22
-
23
-
24
-
25
-
26
-
27
-
28
-
29
-
30
-
31
-
32
-
33
-
34
-
35
-
36
-
 37
37 -
 38
38 -
 39
39 -
 40
40 -
 41
41 -
 42
42 -
 43
43 -
 44
44 -
 45
45 -
 46
46 -
 47
47 -
 48
48 -
 49
49 -
 50
50 -
 51
51 -
 52
52 -
 53
53 -
 54
54 -
 55
55 -
 56
56 -
 57
57 -
58
-
59
-
60
-
61
-
62
-
63
-
64
-
65
-
66
-
67
-
68
-
69
-
70
-
71
-
72
-
73
-
74
-
75
-
76
-
77
-
78
-
79
-
80
-
81
-
82
-
83
-
84
-
85
-
86
-
87
-
88
-
89
-
90
-
91
-
92
-
93
-
94
-
95
-
96
-
97
-
98
-
99
-
100
-
101
-
102
-
103
-
104
-
105
-
106
-
107
-
108
-
109
-
110
-
111
-
112
-
113
-
114
-
115
-
116
-
117
-
118
-
119
-
120
-
121
-
122
-
123
-
124
-
125
-
126
-
127
-
128
-
129
-
130
-
131
-
132
-
133
-
134
-
135
-
136
-
137
-
138
-
139
-
140
 |
 |
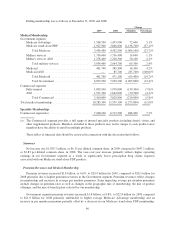
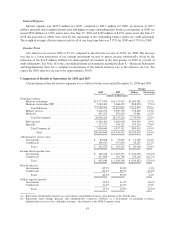
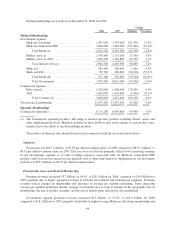
seeking to maximize their benefits once their deductibles are met, and increased COBRA participation. The
membership declines were partially offset by enrollment gains in our individual product, a strategic area of
commercial growth. Individual membership at December 31, 2009 increased 13.0% from December 31, 2008.
This increase in individual membership, together with administrative costs associated with increased business for
our mail-order pharmacy, led to a higher Commercial segment SG&A expense ratio. We expect Commercial
segment medical membership to decline by 160,000 to 180,000 members in 2010.
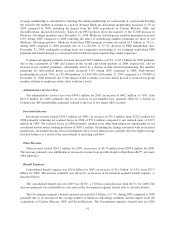
Financial Position
At December 31, 2009, cash, cash equivalents and our investment securities totaled $9.1 billion, or 64.4% of
total assets, with 17.7% of the $9.1 billion invested in cash and cash equivalents. Investment securities consist of
debt securities of investment-grade quality with an average credit rating by S&P of AA+ at December 31, 2009
and an average duration of approximately 4.5 years. Including cash and cash equivalents, the average duration of
our investment portfolio was approximately 3.8 years. We had $5.5 million of mortgage-backed securities
associated with Alt-A or subprime loans at December 31, 2009 and no collateralized debt obligations.
Our net unrealized position improved $301.3 million from a net unrealized loss position of $229.9 million at
December 31, 2008 to a net unrealized gain position of $71.4 million at December 31, 2009. Gross unrealized
losses were $78.4 million at December 31, 2009 compared to $313.0 million at December 31, 2008. Gross
unrealized gains were $149.8 million at December 31, 2009 compared to $83.2 million at December 31, 2008.
All issuers of securities we own trading at an unrealized loss remain current on all contractual payments. We
believe these unrealized losses primarily were caused by an increase in market interest rates and tighter liquidity
conditions in the current markets than when the securities were purchased. As of December 31, 2009, we do not
intend to sell the securities with an unrealized loss position in accumulated other comprehensive income and it is
not likely that we will be required to sell these securities before recovery of their amortized costs basis, and as a
result, we believe that the securities with an unrealized loss are not other-than-temporarily impaired as of
December 31, 2009.
During 2008, we recognized other-than-temporary impairments of $103.1 million of which $68.7 million
resulted from investments in Lehman Brothers Holdings Inc., or Lehman, or its subsidiaries. Lehman and certain
of its subsidiaries filed for bankruptcy protection in 2008. The other impairments primarily relate to declines in
values of securities, primarily associated with the financial services industry. Of the $103.1 million, $48.5
million was allocated to the Government segment and $54.6 million was allocated to the Commercial segment.
There were no material other-than-temporary impairments in 2009.
We continuously review our investment portfolios. There is a continuing risk that further declines in fair
value may occur and additional material realized losses from sales or other-than-temporary impairments may be
recorded in future periods.
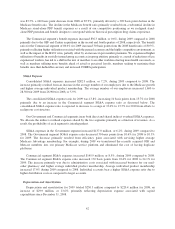
In addition, in the fall of 2008 we terminated all fixed to variable interest-rate swap agreements outstanding
associated with our senior notes based on recent changes in the credit market environment. In exchange for
terminating these interest-rate swap agreements, we received cash of $93.0 million representing the fair value of
the swap assets. This transaction also fixed the interest rate on our senior notes to a weighted-average rate of
6.08%. We may re-enter into swap agreements in the future depending on market conditions and other factors.
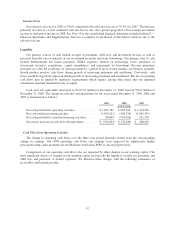
We believe our cash balances, investment securities, operating cash flows, and funds available under our
credit agreement or from other public or private financing sources, taken together, provide adequate resources to
fund ongoing operating and regulatory requirements, future expansion opportunities, and capital expenditures in
the foreseeable future, as well as to refinance or repay debt. Our long-term debt, consisting primarily of senior
notes, of $1,678.2 million represented 22.5% of total capitalization at December 31, 2009, declining from 30.3%
at December 31, 2008. The earliest maturity of our senior notes is in June 2016. We have available a 5-year, $1.0
billion unsecured revolving credit agreement which expires in July 2011. As of December 31, 2009, there were
no borrowings outstanding under this credit agreement.
37