Humana 2009 Annual Report Download - page 73
Download and view the complete annual report
Please find page 73 of the 2009 Humana annual report below. You can navigate through the pages in the report by either clicking on the pages listed below, or by using the keyword search tool below to find specific information within the annual report.-
 1
1 -
2
-
3
-
4
-
5
-
6
-
7
-
8
-
9
-
10
-
11
-
12
-
13
-
14
-
15
-
16
-
17
-
18
-
19
-
20
-
21
-
22
-
23
-
24
-
25
-
26
-
27
-
28
-
29
-
30
-
31
-
32
-
33
-
34
-
35
-
36
-
37
-
38
-
39
-
40
-
41
-
42
-
43
-
44
-
45
-
46
-
47
-
48
-
49
-
50
-
51
-
52
-
53
-
54
-
55
-
56
-
57
-
58
-
59
-
60
-
61
-
62
-
 63
63 -
 64
64 -
 65
65 -
 66
66 -
 67
67 -
 68
68 -
 69
69 -
 70
70 -
 71
71 -
 72
72 -
 73
73 -
 74
74 -
 75
75 -
 76
76 -
 77
77 -
 78
78 -
 79
79 -
 80
80 -
 81
81 -
 82
82 -
 83
83 -
84
-
85
-
86
-
87
-
88
-
89
-
90
-
91
-
92
-
93
-
94
-
95
-
96
-
97
-
98
-
99
-
100
-
101
-
102
-
103
-
104
-
105
-
106
-
107
-
108
-
109
-
110
-
111
-
112
-
113
-
114
-
115
-
116
-
117
-
118
-
119
-
120
-
121
-
122
-
123
-
124
-
125
-
126
-
127
-
128
-
129
-
130
-
131
-
132
-
133
-
134
-
135
-
136
-
137
-
138
-
139
-
140
 |
 |

Our direct exposure to subprime mortgage lending is limited to investment in residential mortgage-backed
securities and asset-backed securities backed by home equity loans. The fair value of securities backed by Alt-A
and subprime loans was $5.5 million at December 31, 2009 and $7.6 million at December 31, 2008. There are no
collateralized debt obligations or structured investment vehicles in our investment portfolio.
The percentage of corporate securities associated with the financial services industry was 37.3% at
December 31, 2009 and 41.7% at December 31, 2008.
Duration is indicative of the relationship between changes in market value and changes in interest rates,
providing a general indication of the sensitivity of the fair values of our debt securities to changes in interest
rates. However, actual market values may differ significantly from estimates based on duration. The average
duration of our debt securities was approximately 4.5 years at December 31, 2009. Including cash equivalents,
the average duration was approximately 3.8 years. Based on the duration including cash equivalents, a 1%
increase in interest rates would generally decrease the fair value of our securities by approximately $340 million.
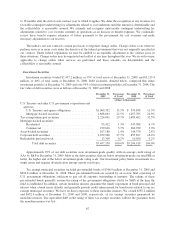
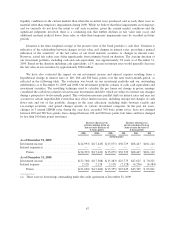
Gross unrealized losses and fair values aggregated by investment category and length of time that individual
securities have been in a continuous unrealized loss position were as follows at December 31, 2009 and 2008,
respectively:
Less than 12 months 12 months or more Total
Fair Value
Gross
Unrealized
Losses Fair Value
Gross
Unrealized
Losses Fair Value
Gross
Unrealized
Losses
(in thousands)
December 31, 2009
U.S. Treasury and other U.S. government
corporations and agencies:
U.S. Treasury and agency
obligations ..................... $ 301,843 $ (2,425) $ 2,970 $ (109) $ 304,813 $ (2,534)
Mortgage-backed securities .......... 823,365 (11,005) 6,834 (323) 830,199 (11,328)
Tax-exempt municipal securities .......... 598,520 (14,286) 198,327 (9,131) 796,847 (23,417)
Mortgage-backed securities:
Residential ....................... 1,771 (5) 73,178 (10,994) 74,949 (10,999)
Commercial ...................... 31,941 (359) 142,944 (8,281) 174,885 (8,640)
Asset-backed securities ................. 1,930 (19) 2,179 (88) 4,109 (107)
Corporate debt securities ................ 636,833 (9,354) 99,830 (11,972) 736,663 (21,326)
Total debt securities ............ $2,396,203 $(37,453) $526,262 $(40,898) $2,922,465 $(78,351)
In April 2009, the Financial Accounting Standards Board, or the FASB, issued new guidance to address
concerns about (1) measuring the fair value of financial instruments when the markets become inactive and
quoted prices may reflect distressed transactions and (2) recording impairment charges on investments in debt
securities. The new guidance highlights and expands on the factors that should be considered in estimating fair
value when the volume and level of activity for a financial asset or liability has significantly decreased and
requires new disclosures relating to fair value measurement inputs and valuation techniques (including changes
in inputs and valuation techniques). In addition, new guidance regarding recognition and presentation of other-
than-temporary impairments changed (1) the trigger for determining whether an other-than-temporary
impairment exists and (2) the amount of an impairment charge to be recorded in earnings. We adopted the
provisions of the new guidance for the quarter ended June 30, 2009. Refer to Note 4 and Note 5 to the
consolidated financial statements included in Item 8.—Financial Statements and Supplementary Data for
disclosures related to the implementation of the new guidance.
63