Humana 2009 Annual Report Download - page 53
Download and view the complete annual report
Please find page 53 of the 2009 Humana annual report below. You can navigate through the pages in the report by either clicking on the pages listed below, or by using the keyword search tool below to find specific information within the annual report.-
 1
1 -
2
-
3
-
4
-
5
-
6
-
7
-
8
-
9
-
10
-
11
-
12
-
13
-
14
-
15
-
16
-
17
-
18
-
19
-
20
-
21
-
22
-
23
-
24
-
25
-
26
-
27
-
28
-
29
-
30
-
31
-
32
-
33
-
34
-
35
-
36
-
37
-
38
-
39
-
40
-
41
-
42
-
 43
43 -
 44
44 -
 45
45 -
 46
46 -
 47
47 -
 48
48 -
 49
49 -
 50
50 -
 51
51 -
 52
52 -
 53
53 -
 54
54 -
 55
55 -
 56
56 -
 57
57 -
 58
58 -
 59
59 -
 60
60 -
 61
61 -
 62
62 -
 63
63 -
64
-
65
-
66
-
67
-
68
-
69
-
70
-
71
-
72
-
73
-
74
-
75
-
76
-
77
-
78
-
79
-
80
-
81
-
82
-
83
-
84
-
85
-
86
-
87
-
88
-
89
-
90
-
91
-
92
-
93
-
94
-
95
-
96
-
97
-
98
-
99
-
100
-
101
-
102
-
103
-
104
-
105
-
106
-
107
-
108
-
109
-
110
-
111
-
112
-
113
-
114
-
115
-
116
-
117
-
118
-
119
-
120
-
121
-
122
-
123
-
124
-
125
-
126
-
127
-
128
-
129
-
130
-
131
-
132
-
133
-
134
-
135
-
136
-
137
-
138
-
139
-
140
 |
 |

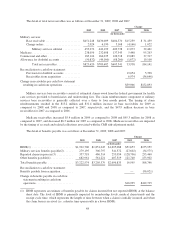
Interest Expense
Interest expense was $105.8 million for 2009, compared to $80.3 million for 2008, an increase of $25.5
million, primarily due to higher interest rates and higher average outstanding debt. In the second quarter of 2008, we
issued $500 million of 7.20% senior notes due June 15, 2018 and $250 million of 8.15% senior notes due June 15,
2038, the proceeds of which were used for the repayment of the outstanding balance under our credit agreement.
The weighted average effective interest rate for all of our long-term debt was 5.97% for 2009 and 4.73% for 2008.
Income Taxes
Our effective tax rate for 2009 of 35.1% compared to the effective tax rate of 34.8% for 2008. The increase
was due to a lower proportion of tax exempt investment income to pretax income substantially offset by the
reduction of the $16.8 million liability for unrecognized tax benefits in the first quarter of 2009 as a result of
audit settlements. See Note 10 to the consolidated financial statements included in Item 8.—Financial Statements
and Supplementary Data for a complete reconciliation of the federal statutory rate to the effective tax rate. We
expect the 2010 effective tax rate to be approximately 36.0%.
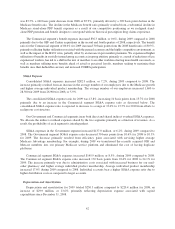
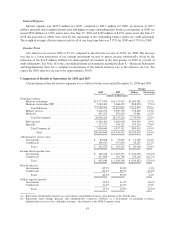
Comparison of Results of Operations for 2008 and 2007
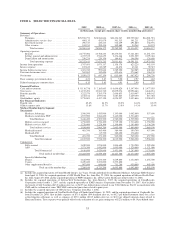
Certain financial data for our two segments was as follows for the years ended December 31, 2008 and 2007:
2008 2007
Change
Dollars Percentage
(dollars in thousands)
Premium revenues:
Medicare Advantage ................................ $13,777,999 $11,173,417 $2,604,582 23.3%
Medicare stand-alone PDP ........................... 3,380,400 3,668,425 (288,025) (7.9)%
Total Medicare ................................. 17,158,399 14,841,842 2,316,557 15.6%
Military services ................................... 3,218,270 2,839,790 378,480 13.3%
Medicaid ......................................... 591,535 555,594 35,941 6.5%
Total Government .............................. 20,968,204 18,237,226 2,730,978 15.0%
Fully-insured ...................................... 6,169,403 5,663,000 506,403 8.9%
Specialty ......................................... 927,237 534,121 393,116 73.6%
Total Commercial .............................. 7,096,640 6,197,121 899,519 14.5%
Total ..................................... $28,064,844 $24,434,347 $3,630,497 14.9%
Administrative services fees:
Government ....................................... $ 85,868 $ 73,659 $ 12,209 16.6%
Commercial ....................................... 366,011 317,856 48,155 15.1%
Total ......................................... $ 451,879 $ 391,515 $ 60,364 15.4%
Income before income taxes:
Government ....................................... $ 785,240 $ 1,027,531 $ (242,291) (23.6)%
Commercial ....................................... 207,608 261,769 (54,161) (20.7)%
Total ......................................... $ 992,848 $ 1,289,300 $ (296,452) (23.0)%
Benefit ratios(a):
Government ....................................... 85.9% 83.8% 2.1%
Commercial ....................................... 80.3% 80.5% (0.2)%
Total ......................................... 84.5% 83.0% 1.5%
SG&A expense ratios(b):
Government ....................................... 10.6% 11.2% (0.6)%
Commercial ....................................... 22.4% 21.5% 0.9%
Total ......................................... 13.7% 13.9% (0.2)%
(a) Represents total benefit expenses as a percentage of premium revenues. Also known as the benefit ratio.
(b) Represents total selling, general, and administrative expenses (SG&A) as a percentage of premium revenues,
administrative services fees, and other revenues. Also known as the SG&A expense ratio.
43