Humana 2009 Annual Report Download - page 49
Download and view the complete annual report
Please find page 49 of the 2009 Humana annual report below. You can navigate through the pages in the report by either clicking on the pages listed below, or by using the keyword search tool below to find specific information within the annual report.-
 1
1 -
2
-
3
-
4
-
5
-
6
-
7
-
8
-
9
-
10
-
11
-
12
-
13
-
14
-
15
-
16
-
17
-
18
-
19
-
20
-
21
-
22
-
23
-
24
-
25
-
26
-
27
-
28
-
29
-
30
-
31
-
32
-
33
-
34
-
35
-
36
-
37
-
38
-
 39
39 -
 40
40 -
 41
41 -
 42
42 -
 43
43 -
 44
44 -
 45
45 -
 46
46 -
 47
47 -
 48
48 -
 49
49 -
 50
50 -
 51
51 -
 52
52 -
 53
53 -
 54
54 -
 55
55 -
 56
56 -
 57
57 -
 58
58 -
 59
59 -
60
-
61
-
62
-
63
-
64
-
65
-
66
-
67
-
68
-
69
-
70
-
71
-
72
-
73
-
74
-
75
-
76
-
77
-
78
-
79
-
80
-
81
-
82
-
83
-
84
-
85
-
86
-
87
-
88
-
89
-
90
-
91
-
92
-
93
-
94
-
95
-
96
-
97
-
98
-
99
-
100
-
101
-
102
-
103
-
104
-
105
-
106
-
107
-
108
-
109
-
110
-
111
-
112
-
113
-
114
-
115
-
116
-
117
-
118
-
119
-
120
-
121
-
122
-
123
-
124
-
125
-
126
-
127
-
128
-
129
-
130
-
131
-
132
-
133
-
134
-
135
-
136
-
137
-
138
-
139
-
140
 |
 |

including supplemental health and life products. This acquisition added approximately 95,900 members,
primarily commercial ASO. On October 1, 2007, we acquired CompBenefits Corporation, or CompBenefits, for
cash consideration of $369.6 million. CompBenefits provides dental and vision insurance benefits and added
approximately 4.4 million specialty members. These acquisitions expanded our commercial product offerings
allowing for significant cross-selling opportunities with our medical insurance products.
On March 1, 2007, we acquired DefenseWeb Technologies, Inc., or DefenseWeb, a company responsible
for delivering customized software solutions for the Department of Defense, for cash consideration of $27.5
million.
Certain of these transactions are more fully described in Note 3 to the consolidated financial statements
included in Item 8.—Financial Statements and Supplementary Data.
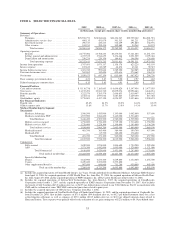
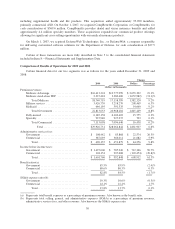
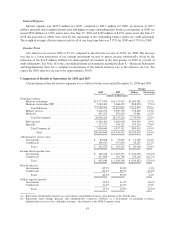
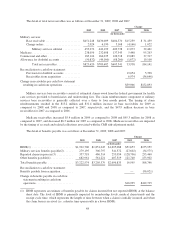
Comparison of Results of Operations for 2009 and 2008
Certain financial data for our two segments was as follows for the years ended December 31, 2009 and
2008:
2009 2008
Change
Dollars Percentage
(dollars in thousands)
Premium revenues:
Medicare Advantage ........................... $16,413,301 $13,777,999 $ 2,635,302 19.1%
Medicare stand-alone PDP ...................... 2,327,418 3,380,400 (1,052,982) (31.1)%
Total Medicare ........................... 18,740,719 17,158,399 1,582,320 9.2%
Military services .............................. 3,426,739 3,218,270 208,469 6.5%
Medicaid .................................... 646,195 591,535 54,660 9.2%
Total Government ......................... 22,813,653 20,968,204 1,845,449 8.8%
Fully-insured ................................. 6,185,158 6,169,403 15,755 0.3%
Specialty .................................... 927,940 927,237 703 0.1%
Total Commercial ......................... 7,113,098 7,096,640 16,458 0.2%
Total ................................ $29,926,751 $28,064,844 $ 1,861,907 6.6%
Administrative services fees:
Government .................................. $ 108,442 $ 85,868 $ 22,574 26.3%
Commercial .................................. 387,693 366,011 21,682 5.9%
Total .................................... $ 496,135 $ 451,879 $ 44,256 9.8%
Income before income taxes:
Government .................................. $ 1,497,606 $ 785,240 $ 712,366 90.7%
Commercial .................................. 104,154 207,608 (103,454) (49.8)%
Total .................................... $ 1,601,760 $ 992,848 $ 608,912 61.3%
Benefit ratios(a):
Government .................................. 83.5% 85.9% (2.4)%
Commercial .................................. 80.6% 80.3% 0.3%
Total .................................... 82.8% 84.5% (1.7)%
SG&A expense ratios(b):
Government .................................. 10.3% 10.6% (0.3)%
Commercial .................................. 24.1% 22.4% 1.7%
Total .................................... 13.8% 13.7% 0.1%
(a) Represents total benefit expenses as a percentage of premium revenues. Also known as the benefit ratio.
(b) Represents total selling, general, and administrative expenses (SG&A) as a percentage of premium revenues,
administrative services fees, and other revenues. Also known as the SG&A expense ratio.
39