Nike 2010 Annual Report Download - page 24
Download and view the complete annual report
Please find page 24 of the 2010 Nike annual report below. You can navigate through the pages in the report by either clicking on the pages listed below, or by using the keyword search tool below to find specific information within the annual report.-
 1
1 -
2
-
3
-
4
-
5
-
6
-
7
-
8
-
9
-
10
-
11
-
12
-
13
-
 14
14 -
 15
15 -
 16
16 -
 17
17 -
 18
18 -
 19
19 -
 20
20 -
 21
21 -
 22
22 -
 23
23 -
 24
24 -
 25
25 -
 26
26 -
 27
27 -
 28
28 -
 29
29 -
 30
30 -
 31
31 -
 32
32 -
 33
33 -
 34
34 -
35
-
36
-
37
-
38
-
39
-
40
-
41
-
42
-
43
-
44
-
45
-
46
-
47
-
48
-
49
-
50
-
51
-
52
-
53
-
54
-
55
-
56
-
57
-
58
-
59
-
60
-
61
-
62
-
63
-
64
-
65
-
66
-
67
-
68
-
69
-
70
-
71
-
72
-
73
-
74
-
75
-
76
-
77
-
78
-
79
-
80
-
81
-
82
-
83
-
84
-
85
-
86
-
87
-
88
-
89
-
90
-
91
-
92
-
93
-
94
-
95
-
96
-
97
-
98
-
99
-
100
-
101
-
102
-
103
-
104
-
105
-
106
-
107
-
108
-
109
-
110
-
111
-
112
-
113
-
114
-
115
-
116
-
117
-
118
-
119
-
120
-
121
-
122
-
123
-
124
-
125
-
126
-
127
-
128
-
129
-
130
-
131
-
132
-
133
-
134
-
135
-
136
-
137
-
138
-
139
-
140
-
141
-
142
-
143
-
144
 |
 |

Table of Contents
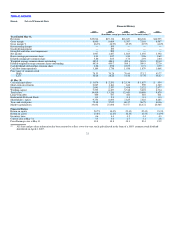
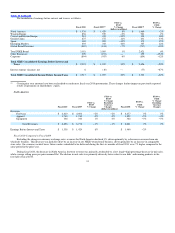
Item 6. Selected Financial Data
Financial History
2010 2009 2008 2007 2006
(In millions, except per share data and financial ratios)(1)
Year Ended May 31,
Revenues $19,014 $19,176 $18,627 $16,326 $14,955
Gross margin 8,800 8,604 8,387 7,161 6,587
Gross margin % 46.3% 44.9% 45.0% 43.9% 44.0%
Restructuring charges — 195 — — —
Goodwill impairment — 199 — — —
Intangible and other asset impairment — 202 — — —
Net income 1,907 1,487 1,883 1,492 1,392
Basic earnings per common share 3.93 3.07 3.80 2.96 2.69
Diluted earnings per common share 3.86 3.03 3.74 2.93 2.64
Weighted average common shares outstanding 485.5 484.9 495.6 503.8 518.0
Diluted weighted average common shares outstanding 493.9 490.7 504.1 509.9 527.6
Cash dividends declared per common share 1.06 0.98 0.875 0.71 0.59
Cash flow from operations 3,164 1,736 1,936 1,879 1,668
Price range of common stock
High 78.55 70.28 70.60 57.12 45.77
Low 50.16 38.24 51.50 37.76 38.27
At May 31,
Cash and equivalents $ 3,079 $ 2,291 $ 2,134 $ 1,857 $ 954
Short−term investments 2,067 1,164 642 990 1,349
Inventories 2,041 2,357 2,438 2,122 2,077
Working capital 7,595 6,457 5,518 5,493 4,734
Total assets 14,419 13,250 12,443 10,688 9,870
Long−term debt 446 437 441 410 411
Redeemable Preferred Stock 0.3 0.3 0.3 0.3 0.3
Shareholders’ equity 9,754 8,693 7,825 7,025 6,285
Year−end stock price 72.38 57.05 68.37 56.75 40.16
Market capitalization 35,032 27,698 33,577 28,472 20,565
Financial Ratios:
Return on equity 20.7% 18.0% 25.4% 22.4% 23.3%
Return on assets 13.8% 11.6% 16.3% 14.5% 14.9%
Inventory turns 4.6 4.4 4.5 4.4 4.3
Current ratio at May 31 3.3 3.0 2.7 3.1 2.8
Price/Earnings ratio at May 31 18.8 18.8 18.3 19.4 15.2
(1) All share and per share information has been restated to reflect a two−for−one stock split affected in the form of a 100% common stock dividend
distributed on April 2, 2007.
21