Nike 2010 Annual Report Download - page 29
Download and view the complete annual report
Please find page 29 of the 2010 Nike annual report below. You can navigate through the pages in the report by either clicking on the pages listed below, or by using the keyword search tool below to find specific information within the annual report.-
 1
1 -
2
-
3
-
4
-
5
-
6
-
7
-
8
-
9
-
10
-
11
-
12
-
13
-
14
-
15
-
16
-
17
-
18
-
 19
19 -
 20
20 -
 21
21 -
 22
22 -
 23
23 -
 24
24 -
 25
25 -
 26
26 -
 27
27 -
 28
28 -
 29
29 -
 30
30 -
 31
31 -
 32
32 -
 33
33 -
 34
34 -
 35
35 -
 36
36 -
 37
37 -
 38
38 -
 39
39 -
40
-
41
-
42
-
43
-
44
-
45
-
46
-
47
-
48
-
49
-
50
-
51
-
52
-
53
-
54
-
55
-
56
-
57
-
58
-
59
-
60
-
61
-
62
-
63
-
64
-
65
-
66
-
67
-
68
-
69
-
70
-
71
-
72
-
73
-
74
-
75
-
76
-
77
-
78
-
79
-
80
-
81
-
82
-
83
-
84
-
85
-
86
-
87
-
88
-
89
-
90
-
91
-
92
-
93
-
94
-
95
-
96
-
97
-
98
-
99
-
100
-
101
-
102
-
103
-
104
-
105
-
106
-
107
-
108
-
109
-
110
-
111
-
112
-
113
-
114
-
115
-
116
-
117
-
118
-
119
-
120
-
121
-
122
-
123
-
124
-
125
-
126
-
127
-
128
-
129
-
130
-
131
-
132
-
133
-
134
-
135
-
136
-
137
-
138
-
139
-
140
-
141
-
142
-
143
-
144
 |
 |

Table of Contents
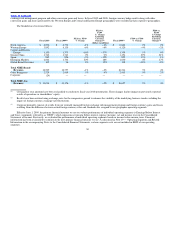
over 2 percentage points. During fiscal 2009, most of our geographies posted higher revenues. By product group, our worldwide NIKE Brand footwear
business reported revenue growth of 6% and contributed $575 million of incremental revenue. Worldwide NIKE Brand apparel revenues were in line with
the prior year, while equipment revenues declined 2% or $20 million.
Our Other Businesses, comprised of results from Cole Haan, Converse Inc., Hurley International LLC, NIKE Golf, and Umbro in fiscal 2009,
constituted the remaining revenue. In fiscal 2008, our Other Businesses also included Exeter Brands Group (whose primary business was the Starter brand
business which was sold on December 17, 2007) and NIKE Bauer Hockey (which was sold on April 17, 2008). Umbro was acquired on March 3, 2008.
Revenues for these businesses were flat compared to fiscal 2008.
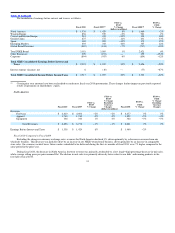
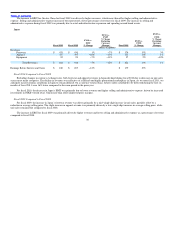
Gross Margin
Fiscal 2010 Fiscal 2009
FY10 vs.
FY09
% Change Fiscal 2008
FY09 vs.
FY08
% Change
(In millions)
Gross Margin $ 8,800 $ 8,604 2% $ 8,387 3%
Gross Margin % 46.3% 44.9% 140 bps 45.0% (10 bps)
Fiscal 2010 Compared to Fiscal 2009
For fiscal 2010, our consolidated gross margin percentage was 140 basis points higher than the prior year. The primary factors contributing to this
improvement were as follows:
• Improved in−line product margins across most geographies, driven by reduced raw material and freight costs as well as favorable changes in
product mix;
• Improved inventory positions, most notably in North America and Western Europe, which drove a shift in mix from discounted close−out to
higher margin in−line sales; and
• Growth of NIKE−owned retail as a percentage of total revenue, across most NIKE Brand geographies, driven by an increase in both new store
openings and comparable store sales.
Together, these factors increased consolidated gross margins by approximately 160 basis points for fiscal 2010. These increases were partially offset
by the impact of unfavorable currency exchange rates, primarily affecting our Emerging Markets and Central and Eastern Europe geographies.
We anticipate our gross margins in fiscal 2011 may be negatively impacted by macroeconomic factors including changes in currency exchange rates
and rising costs for product input costs. We also anticipate higher air freight costs as we work with our suppliers to meet increasing demand for certain
running footwear products in the first half of the year.
Fiscal 2009 Compared to Fiscal 2008
During fiscal 2009, the primary factors contributing to the 10 basis point decline in consolidated gross margin percentage versus the prior year were
lower gross pricing margins and increased discounts which, when combined, decreased consolidated gross margins by approximately 60 basis points. This
decrease was partially offset by improved hedge rates relative to the prior year, primarily in the Western Europe and Central and Eastern Europe
geographies. Gross pricing margins were lower, primarily driven by higher product input costs, most notably for footwear products. Higher levels of
discounts were provided across all businesses in fiscal 2009 to manage inventory levels.
26