Nike 2010 Annual Report Download - page 26
Download and view the complete annual report
Please find page 26 of the 2010 Nike annual report below. You can navigate through the pages in the report by either clicking on the pages listed below, or by using the keyword search tool below to find specific information within the annual report.-
 1
1 -
2
-
3
-
4
-
5
-
6
-
7
-
8
-
9
-
10
-
11
-
12
-
13
-
14
-
15
-
 16
16 -
 17
17 -
 18
18 -
 19
19 -
 20
20 -
 21
21 -
 22
22 -
 23
23 -
 24
24 -
 25
25 -
 26
26 -
 27
27 -
 28
28 -
 29
29 -
 30
30 -
 31
31 -
 32
32 -
 33
33 -
 34
34 -
 35
35 -
 36
36 -
37
-
38
-
39
-
40
-
41
-
42
-
43
-
44
-
45
-
46
-
47
-
48
-
49
-
50
-
51
-
52
-
53
-
54
-
55
-
56
-
57
-
58
-
59
-
60
-
61
-
62
-
63
-
64
-
65
-
66
-
67
-
68
-
69
-
70
-
71
-
72
-
73
-
74
-
75
-
76
-
77
-
78
-
79
-
80
-
81
-
82
-
83
-
84
-
85
-
86
-
87
-
88
-
89
-
90
-
91
-
92
-
93
-
94
-
95
-
96
-
97
-
98
-
99
-
100
-
101
-
102
-
103
-
104
-
105
-
106
-
107
-
108
-
109
-
110
-
111
-
112
-
113
-
114
-
115
-
116
-
117
-
118
-
119
-
120
-
121
-
122
-
123
-
124
-
125
-
126
-
127
-
128
-
129
-
130
-
131
-
132
-
133
-
134
-
135
-
136
-
137
-
138
-
139
-
140
-
141
-
142
-
143
-
144
 |
 |

Table of Contents
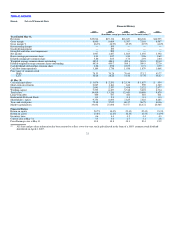
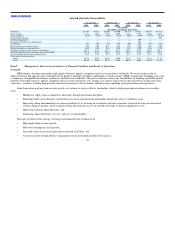
Since the adoption of this long−term strategy in 2001, NIKE, Inc.’s revenues and earnings per share have grown 8% and 14%, respectively, on an
annual compounded basis. During the same period, our return on invested capital has increased from 14% to 21%. While macroeconomic conditions in
fiscal 2010 continued to remain challenging, putting significant pressure on consumer spending in most markets worldwide, we have continued to focus on
achieving appropriate financial performance, while extending our market leadership and positioning ourselves for sustainable, profitable growth over the
long term.
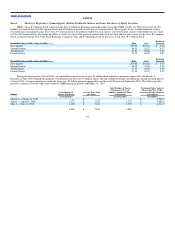
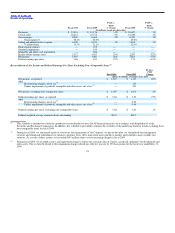
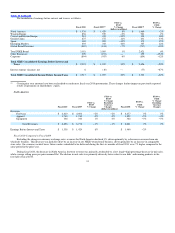
NIKE, Inc.’s fiscal 2010 revenues declined 1% to $19.0 billion, net income increased 28% to $1.9 billion, and we delivered diluted earnings per share
of $3.86, a 27% increase versus fiscal 2009. Our fiscal 2009 reported results contain significant non−comparable transactions, including an after−tax charge
of $145 million for restructuring activities, recorded in the fourth quarter of fiscal 2009, and an after−tax charge of $241 million for the impairment of
goodwill, intangible and other assets of Umbro, which was recorded in the third quarter of fiscal 2009. Excluding these non−comparable items, our fiscal
2010 net income would have increased 2% and diluted earnings per share would have increased 1% compared to fiscal 2009 (see Reconciliation of Net
Income and Diluted Earnings Per Share Excluding Non−Comparable items below). The increase in net income excluding non−comparable items was
primarily driven by an improved gross margin percentage and a reduction in our effective tax rate, which more than offset the reduction in revenues and
higher selling and administrative expenses. The increase in gross margin percentage was primarily the result of favorable product mix, cost reduction
initiatives, lower input costs and sales growth in our NIKE−owned retail business. Our year−over−year effective tax rate improvement was driven by
continued benefit from our international businesses, which are generally taxed at rates lower than the U.S. statutory rate. The increase in selling and
administrative expense was primarily attributable to an increase in performance−based compensation as well as investments in our NIKE−owned retail
business, which more than offset reductions in compensation expense resulting from restructuring activities that took place in the fourth quarter of fiscal
2009. For fiscal 2010, diluted earnings per share grew at a slightly lower rate than net income given higher average outstanding shares. In fiscal 2010, we
increased cash flow from operations as a result of working capital reductions, reflecting our efforts to aggressively manage inventory levels and accounts
receivable collections. At May 31, 2010, our inventory and accounts receivable balances were down 13% and 8%, respectively, compared to May 31, 2009.
During fiscal 2010, we also returned larger amounts of cash to our shareholders through higher dividends and increased share repurchases compared to
fiscal 2009.
Although most of our businesses reported revenue declines in the first half of fiscal 2010, the majority returned to growth in the second half of fiscal
2010. Futures orders for NIKE Brand Footwear and Apparel scheduled for delivery during the first six months of fiscal 2011 increased 7% as compared to
the same periods in the prior year. While we continue to believe that the Company is well positioned from a business and financial perspective, our future
performance is subject to the inherent uncertainty presented by volatile macroeconomic conditions that may have an impact on our operations around the
world. These conditions could continue to affect our business in a number of direct and indirect ways, including lower revenue from slowing
consumer/customer demand for our products, reduced profit margins and/or increased costs, changes in interest and currency exchange rates, lack of credit
availability and business disruptions due to difficulties experienced by suppliers and customers. Our future performance is subject to our continued ability to
take appropriate actions to respond to these conditions.
23