Nike 2010 Annual Report Download - page 33
Download and view the complete annual report
Please find page 33 of the 2010 Nike annual report below. You can navigate through the pages in the report by either clicking on the pages listed below, or by using the keyword search tool below to find specific information within the annual report.-
 1
1 -
2
-
3
-
4
-
5
-
6
-
7
-
8
-
9
-
10
-
11
-
12
-
13
-
14
-
15
-
16
-
17
-
18
-
19
-
20
-
21
-
22
-
 23
23 -
 24
24 -
 25
25 -
 26
26 -
 27
27 -
 28
28 -
 29
29 -
 30
30 -
 31
31 -
 32
32 -
 33
33 -
 34
34 -
 35
35 -
 36
36 -
 37
37 -
 38
38 -
 39
39 -
 40
40 -
 41
41 -
 42
42 -
 43
43 -
44
-
45
-
46
-
47
-
48
-
49
-
50
-
51
-
52
-
53
-
54
-
55
-
56
-
57
-
58
-
59
-
60
-
61
-
62
-
63
-
64
-
65
-
66
-
67
-
68
-
69
-
70
-
71
-
72
-
73
-
74
-
75
-
76
-
77
-
78
-
79
-
80
-
81
-
82
-
83
-
84
-
85
-
86
-
87
-
88
-
89
-
90
-
91
-
92
-
93
-
94
-
95
-
96
-
97
-
98
-
99
-
100
-
101
-
102
-
103
-
104
-
105
-
106
-
107
-
108
-
109
-
110
-
111
-
112
-
113
-
114
-
115
-
116
-
117
-
118
-
119
-
120
-
121
-
122
-
123
-
124
-
125
-
126
-
127
-
128
-
129
-
130
-
131
-
132
-
133
-
134
-
135
-
136
-
137
-
138
-
139
-
140
-
141
-
142
-
143
-
144
 |
 |

Table of Contents
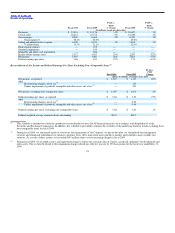
exchange risk management program and other conversion gains and losses. In fiscal 2009 and 2008, foreign currency hedge results along with other
conversion gains and losses generated by the Western Europe and Central and Eastern Europe geographies were recorded in their respective geographies.
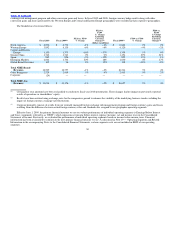
The breakdown of revenues follows:
Fiscal 2010 Fiscal 2009(1) FY10 vs. FY09
% Change
FY10 vs.
FY09
% Change
Excluding
Currency
Changes(2) Fiscal 2008(1) FY09 vs. FY08
% Change
FY09 vs.
FY08
% Change
Excluding
Currency
Changes(2)
(dollars in millions)
North America $ 6,696 $ 6,778 −1% −1% $ 6,661 2% 2%
Western Europe 3,892 4,139 −6% −6% 4,320 −4% −2%
Central and Eastern
Europe 1,150 1,373 −16% −17% 1,309 5% 9%
Greater China 1,742 1,743 0% 0% 1,354 29% 21%
Japan 882 926 −5% −12% 822 13% 1%
Emerging Markets 2,042 1,702 20% 18% 1,630 4% 17%
Global Brand Divisions 105 96 9% 12% 118 −19% −9%
Total NIKE Brand
Revenues 16,509 16,757 −1% −2% 16,214 3% 4%
Other Businesses 2,529 2,419 5% 4% 2,413 0% 2%
Corporate(3) (24) — — — — — —
Total NIKE, Inc.
Revenues $ 19,014 $ 19,176 −1% −2% $ 18,627 3% 4%
(1) Certain prior year amounts have been reclassified to conform to fiscal year 2010 presentation. These changes had no impact on previously reported
results of operations or shareholders’ equity.
(2) Results have been restated using exchange rates for the comparative period to enhance the visibility of the underlying business trends excluding the
impact of foreign currency exchange rate fluctuations.
(3) Corporate primarily consists of results from our centrally managed foreign exchange risk management program and foreign currency gains and losses
resulting from the difference between actual foreign currency rates and standard rates assigned to our geographic operating segments.
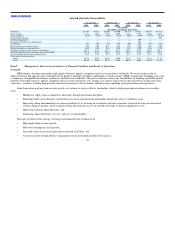
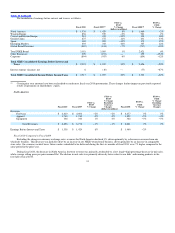
Effective June 1, 2009, the primary financial measure we use to evaluate performance of individual operating segments is Earnings Before Interest
and Taxes (commonly referred to as “EBIT”) which represents net income before interest expense (income), net and income taxes in the Consolidated
Statements of Income. Previously, we evaluated the performance of individual operating segments based on income before income taxes. Financial
information has been reclassified to conform to the new primary financial measure we use. As discussed in Note 19 — Operating Segments and Related
Information in the accompanying Notes to the Consolidated Financial Statements, certain corporate costs are not included in EBIT of our operating
segments.
30