Nike 2010 Annual Report Download - page 41
Download and view the complete annual report
Please find page 41 of the 2010 Nike annual report below. You can navigate through the pages in the report by either clicking on the pages listed below, or by using the keyword search tool below to find specific information within the annual report.-
 1
1 -
2
-
3
-
4
-
5
-
6
-
7
-
8
-
9
-
10
-
11
-
12
-
13
-
14
-
15
-
16
-
17
-
18
-
19
-
20
-
21
-
22
-
23
-
24
-
25
-
26
-
27
-
28
-
29
-
30
-
 31
31 -
 32
32 -
 33
33 -
 34
34 -
 35
35 -
 36
36 -
 37
37 -
 38
38 -
 39
39 -
 40
40 -
 41
41 -
 42
42 -
 43
43 -
 44
44 -
 45
45 -
 46
46 -
 47
47 -
 48
48 -
 49
49 -
 50
50 -
 51
51 -
52
-
53
-
54
-
55
-
56
-
57
-
58
-
59
-
60
-
61
-
62
-
63
-
64
-
65
-
66
-
67
-
68
-
69
-
70
-
71
-
72
-
73
-
74
-
75
-
76
-
77
-
78
-
79
-
80
-
81
-
82
-
83
-
84
-
85
-
86
-
87
-
88
-
89
-
90
-
91
-
92
-
93
-
94
-
95
-
96
-
97
-
98
-
99
-
100
-
101
-
102
-
103
-
104
-
105
-
106
-
107
-
108
-
109
-
110
-
111
-
112
-
113
-
114
-
115
-
116
-
117
-
118
-
119
-
120
-
121
-
122
-
123
-
124
-
125
-
126
-
127
-
128
-
129
-
130
-
131
-
132
-
133
-
134
-
135
-
136
-
137
-
138
-
139
-
140
-
141
-
142
-
143
-
144
 |
 |

Table of Contents
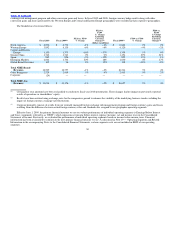
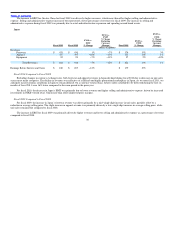
Global Brand Divisions
Fiscal 2010 Fiscal 2009
FY10 vs.
FY09
% Change
FY10 vs.
FY09
% Change
Excluding
Currency
Changes Fiscal 2008
FY09 vs.
FY08
% Change
FY09 vs.
FY08
% Change
Excluding
Currency
Changes
(dollars in millions)
Revenues $ 105 $ 96 9% 12% $ 118 −19% −9%
Loss Before Interest and
Taxes $ (867) $ (811) 7% $ (737) 10%
Global Brand Divisions primarily represent NIKE Brand licensing businesses that are not part of a geographic operating segment and selling, general
and administrative expenses that are centrally managed for the NIKE Brand.
Fiscal 2010 Compared to Fiscal 2009
For fiscal 2010, the increase in Global Brand Division’s loss before interest and taxes was largely due to increases in centrally managed demand
creation expense and performance−based compensation, which more than offset an increase in licensing revenues. The increase in demand creation expense
was primarily driven by the centralization of certain marketing production costs.
Fiscal 2009 Compared to Fiscal 2008
The increase in Global Brand Division’s loss before interest and taxes was mainly attributable to a decrease in licensing revenues and an increase in
selling and administrative expense driven by higher operating overhead and increased demand creation spending.
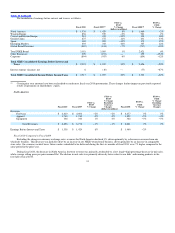
Other Businesses
Fiscal 2010 Fiscal 2009
FY10 vs.
FY09
% Change
FY10 vs.
FY09
% Change
Excluding
Currency
Changes Fiscal 2008
FY09 vs.
FY08
% Change
FY09 vs.
FY08
% Change
Excluding
Currency
Changes
(dollars in millions)
Revenues
Converse $ 983 $ 915 7% 7% $ 729 26% 26%
NIKE Golf 638 648 −2% −4% 725 −11% −10%
Cole Haan 463 472 −2% −2% 496 −5% −5%
Hurley 221 203 9% 9% 171 19% 19%
Umbro 224 174 29% 30% 54 222% 280%
Bauer — — — — 202 — —
Exeter — — — — 35 — —
Other — 7 — — 1 — —
Revenues $ 2,529 $ 2,419 5% 4% $ 2,413 0% 2%
Earnings (Loss) Before
Interest and Taxes $ 299 $ (193) — $ 359 −154%
38