Nike 2010 Annual Report Download - page 83
Download and view the complete annual report
Please find page 83 of the 2010 Nike annual report below. You can navigate through the pages in the report by either clicking on the pages listed below, or by using the keyword search tool below to find specific information within the annual report.-
 1
1 -
2
-
3
-
4
-
5
-
6
-
7
-
8
-
9
-
10
-
11
-
12
-
13
-
14
-
15
-
16
-
17
-
18
-
19
-
20
-
21
-
22
-
23
-
24
-
25
-
26
-
27
-
28
-
29
-
30
-
31
-
32
-
33
-
34
-
35
-
36
-
37
-
38
-
39
-
40
-
41
-
42
-
43
-
44
-
45
-
46
-
47
-
48
-
49
-
50
-
51
-
52
-
53
-
54
-
55
-
56
-
57
-
58
-
59
-
60
-
61
-
62
-
63
-
64
-
65
-
66
-
67
-
68
-
69
-
70
-
71
-
72
-
 73
73 -
 74
74 -
 75
75 -
 76
76 -
 77
77 -
 78
78 -
 79
79 -
 80
80 -
 81
81 -
 82
82 -
 83
83 -
 84
84 -
 85
85 -
 86
86 -
 87
87 -
 88
88 -
 89
89 -
 90
90 -
 91
91 -
 92
92 -
 93
93 -
94
-
95
-
96
-
97
-
98
-
99
-
100
-
101
-
102
-
103
-
104
-
105
-
106
-
107
-
108
-
109
-
110
-
111
-
112
-
113
-
114
-
115
-
116
-
117
-
118
-
119
-
120
-
121
-
122
-
123
-
124
-
125
-
126
-
127
-
128
-
129
-
130
-
131
-
132
-
133
-
134
-
135
-
136
-
137
-
138
-
139
-
140
-
141
-
142
-
143
-
144
 |
 |

Table of Contents NIKE, INC.
NOTES TO CONSOLIDATED FINANCIAL STATEMENTS — (Continued)
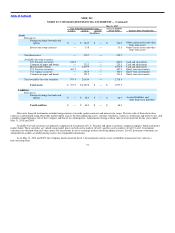
The following summarizes the stock option transactions under the plan discussed above:
Shares
Weighted
Average
Option
Price
(In millions)
Options outstanding May 31, 2007 39.7 $ 35.50
Exercised (9.1) 33.45
Forfeited (0.9) 44.44
Granted 6.9 58.50
Options outstanding May 31, 2008 36.6 $ 40.14
Exercised (4.0) 35.70
Forfeited (1.3) 51.19
Granted 7.5 58.17
Options outstanding May 31, 2009 38.8 $ 43.69
Exercised (8.6) 37.64
Forfeited (0.6) 51.92
Granted 6.4 52.79
Options outstanding May 31, 2010 36.0 $ 46.60
Options exercisable at May 31,
2008 16.2 $ 32.35
2009 21.4 36.91
2010 20.4 41.16
The weighted average contractual life remaining for options outstanding and options exercisable at May 31, 2010 was 6.2 years and 4.8 years,
respectively. The aggregate intrinsic value for options outstanding and exercisable at May 31, 2010 was $926.8 million and $636.0 million, respectively.
The aggregate intrinsic value was the amount by which the market value of the underlying stock exceeded the exercise price of the options. The total
intrinsic value of the options exercised during the years ended May 31, 2010, 2009 and 2008 was $239.3 million, $108.4 million and $259.4 million,
respectively.
In addition to the 1990 Plan, the Company gives employees the right to purchase shares at a discount to the market price under employee stock
purchase plans (“ESPPs”). Employees are eligible to participate through payroll deductions up to 10% of their compensation. At the end of each six−month
offering period, shares are purchased by the participants at 85% of the lower of the fair market value at the beginning or the end of the offering period.
Employees purchased 0.8 million shares, 1.0 million shares and 0.8 million shares during the years ended May 31, 2010, 2009 and 2008, respectively.
From time to time, the Company grants restricted stock and unrestricted stock to key employees under the 1990 Plan. The number of shares granted to
employees during the years ended May 31, 2010, 2009 and 2008 were 499,000, 75,000 and 110,000 with weighted average values per share of $53.16,
$56.97 and $59.50, respectively. Recipients of restricted shares are entitled to cash dividends and to vote their respective shares throughout the period of
restriction. The value of all of the granted shares was established by the market price on the date of grant. During the years ended May 31, 2010, 2009 and
2008, the fair value of restricted shares vested was $8.0 million, $9.9 million and $9.0 million, respectively, determined as of the date of vesting.
80