Nike 2010 Annual Report Download - page 72
Download and view the complete annual report
Please find page 72 of the 2010 Nike annual report below. You can navigate through the pages in the report by either clicking on the pages listed below, or by using the keyword search tool below to find specific information within the annual report.-
 1
1 -
2
-
3
-
4
-
5
-
6
-
7
-
8
-
9
-
10
-
11
-
12
-
13
-
14
-
15
-
16
-
17
-
18
-
19
-
20
-
21
-
22
-
23
-
24
-
25
-
26
-
27
-
28
-
29
-
30
-
31
-
32
-
33
-
34
-
35
-
36
-
37
-
38
-
39
-
40
-
41
-
42
-
43
-
44
-
45
-
46
-
47
-
48
-
49
-
50
-
51
-
52
-
53
-
54
-
55
-
56
-
57
-
58
-
59
-
60
-
61
-
 62
62 -
 63
63 -
 64
64 -
 65
65 -
 66
66 -
 67
67 -
 68
68 -
 69
69 -
 70
70 -
 71
71 -
 72
72 -
 73
73 -
 74
74 -
 75
75 -
 76
76 -
 77
77 -
 78
78 -
 79
79 -
 80
80 -
 81
81 -
 82
82 -
83
-
84
-
85
-
86
-
87
-
88
-
89
-
90
-
91
-
92
-
93
-
94
-
95
-
96
-
97
-
98
-
99
-
100
-
101
-
102
-
103
-
104
-
105
-
106
-
107
-
108
-
109
-
110
-
111
-
112
-
113
-
114
-
115
-
116
-
117
-
118
-
119
-
120
-
121
-
122
-
123
-
124
-
125
-
126
-
127
-
128
-
129
-
130
-
131
-
132
-
133
-
134
-
135
-
136
-
137
-
138
-
139
-
140
-
141
-
142
-
143
-
144
 |
 |
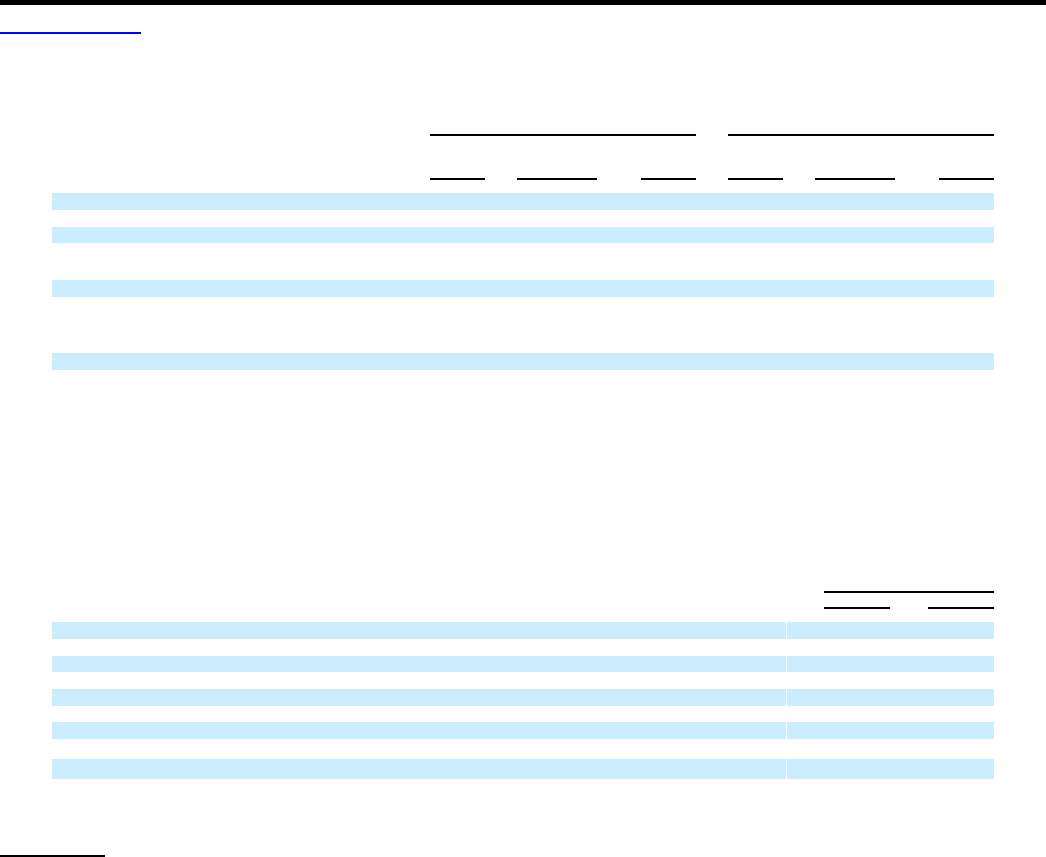
Table of Contents NIKE, INC.
NOTES TO CONSOLIDATED FINANCIAL STATEMENTS — (Continued)
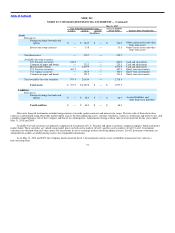
The following table summarizes the Company’s identifiable intangible asset balances as of May 31, 2010 and 2009.
May 31, 2010 May 31, 2009
Gross
Carrying
Amount Accumulated
Amortization
Net
Carrying
Amount
Gross
Carrying
Amount Accumulated
Amortization
Net
Carrying
Amount
(In millions)
Amortized intangible assets:
Patents $ 68.5 $ (20.8) $ 47.7 $ 56.6 $ (17.2) $ 39.4
Trademarks 40.2 (17.8) 22.4 37.5 (10.9) 26.6
Other 32.7 (18.8) 13.9 40.0 (19.6) 20.4
Total $ 141.4 $ (57.4) $ 84.0 $ 134.1 $ (47.7) $ 86.4
Unamortized intangible assets — Trademarks $ 383.0 $ 381.0
Identifiable intangible assets, net $ 467.0 $ 467.4
The effect of foreign exchange fluctuations for the year ended May 31, 2010 increased unamortized intangible assets by approximately $2 million.
Amortization expense, which is included in selling and administrative expense, was $13.5 million, $11.9 million and $9.2 million for the years ended
May 31, 2010, 2009 and 2008, respectively. The estimated amortization expense for intangible assets subject to amortization for each of the years ending
May 31, 2011 through May 31, 2015 are as follows: 2011: $13.4 million; 2012: $12.7 million; 2013: $10.8 million; 2014: $8.7 million; 2015: $5.1 million.
Note 5 — Accrued Liabilities
Accrued liabilities included the following:
May 31,
2010 2009
(In millions)
Compensation and benefits, excluding taxes $ 598.8 $ 491.9
Endorser compensation 266.9 237.1
Fair value of derivatives 163.6 68.9
Taxes other than income taxes 157.9 161.9
Dividends payable 130.7 121.4
Advertising and marketing 124.9 97.6
Import and logistics costs 80.0 59.4
Restructuring charges(1) 8.2 149.6
Other(2) 373.4 396.1
$ 1,904.4 $ 1,783.9
(1) Accrued restructuring charges primarily consist of severance costs relating to the Company’s restructuring activities that took place during the year
ended May 31, 2009. See Note 16 — Restructuring Charges for more information.
(2) Other consists of various accrued expenses and no individual item accounted for more than 5% of the balance at May 31, 2010 and 2009.
69