Nike 2010 Annual Report Download - page 76
Download and view the complete annual report
Please find page 76 of the 2010 Nike annual report below. You can navigate through the pages in the report by either clicking on the pages listed below, or by using the keyword search tool below to find specific information within the annual report.-
 1
1 -
2
-
3
-
4
-
5
-
6
-
7
-
8
-
9
-
10
-
11
-
12
-
13
-
14
-
15
-
16
-
17
-
18
-
19
-
20
-
21
-
22
-
23
-
24
-
25
-
26
-
27
-
28
-
29
-
30
-
31
-
32
-
33
-
34
-
35
-
36
-
37
-
38
-
39
-
40
-
41
-
42
-
43
-
44
-
45
-
46
-
47
-
48
-
49
-
50
-
51
-
52
-
53
-
54
-
55
-
56
-
57
-
58
-
59
-
60
-
61
-
62
-
63
-
64
-
65
-
 66
66 -
 67
67 -
 68
68 -
 69
69 -
 70
70 -
 71
71 -
 72
72 -
 73
73 -
 74
74 -
 75
75 -
 76
76 -
 77
77 -
 78
78 -
 79
79 -
 80
80 -
 81
81 -
 82
82 -
 83
83 -
 84
84 -
 85
85 -
 86
86 -
87
-
88
-
89
-
90
-
91
-
92
-
93
-
94
-
95
-
96
-
97
-
98
-
99
-
100
-
101
-
102
-
103
-
104
-
105
-
106
-
107
-
108
-
109
-
110
-
111
-
112
-
113
-
114
-
115
-
116
-
117
-
118
-
119
-
120
-
121
-
122
-
123
-
124
-
125
-
126
-
127
-
128
-
129
-
130
-
131
-
132
-
133
-
134
-
135
-
136
-
137
-
138
-
139
-
140
-
141
-
142
-
143
-
144
 |
 |

Table of Contents NIKE, INC.
NOTES TO CONSOLIDATED FINANCIAL STATEMENTS — (Continued)
Short−term Investments
As of May 31, 2010 and 2009, short−term investments consisted of available−for−sale securities. As of May 31, 2010, the Company held $1,900.4
million of available−for−sale securities with maturity dates within one year and $166.4 million with maturity dates over one year and less than five years
within short−term investments. As of May 31, 2009, the Company held $1,005.0 million of available−for−sale securities with maturity dates within one year
and $159.0 million with maturity dates over one year and less than five years within short−term investments.
Short−term investments classified as available−for−sale consist of the following at fair value:
As of May 31,
2010 2009
(In millions)
Available−for−sale investments:
U.S. treasury and agencies $ 1,382.5 $ 772.8
Commercial paper and bonds 684.3 391.2
Total available−for−sale investments $ 2,066.8 $ 1,164.0
Included in interest expense (income), net for the years ended May 31, 2010, 2009 and 2008 was interest income of $30.1 million, $49.7 million, and
$115.8 million, respectively, related to cash and equivalents and short−term investments.
For fair value information regarding notes payable and long−term debt, refer to Note 7 — Short−Term Borrowings and Credit Lines and Note 8 —
Long−Term Debt.
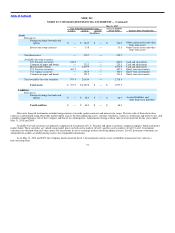
Note 7 — Short−Term Borrowings and Credit Lines
Notes payable to banks and interest−bearing accounts payable to Sojitz Corporation of America (“Sojitz America”) as of May 31, 2010 and 2009, are
summarized below:
May 31,
2010 2009
Borrowings Interest
Rate Borrowings Interest
Rate
(In millions)
Notes payable:
Commercial paper $ — — $ 100.0 0.40%
U.S. operations 18.0 —(1) 31.2 1.81%(1)
Non−U.S. operations 120.6 6.35%(1) 211.7 4.15%(1)
$ 138.6 $ 342.9
Sojitz America $ 88.2 1.07% $ 78.5 1.57%
(1) Weighted average interest rate includes non−interest bearing overdrafts.
The carrying amounts reflected in the consolidated balance sheet for notes payable approximate fair value.
The Company purchases through Sojitz America certain athletic footwear, apparel and equipment it acquires from non−U.S. suppliers. These
purchases are for the Company’s operations outside of the United States, Europe and Japan. Accounts payable to Sojitz America are generally due up to 60
days after shipment of goods from the foreign port. The interest rate on such accounts payable is the 60−day London Interbank Offered Rate (“LIBOR”) as
of the beginning of the month of the invoice date, plus 0.75%.
73