Nike 2010 Annual Report Download - page 28
Download and view the complete annual report
Please find page 28 of the 2010 Nike annual report below. You can navigate through the pages in the report by either clicking on the pages listed below, or by using the keyword search tool below to find specific information within the annual report.-
 1
1 -
2
-
3
-
4
-
5
-
6
-
7
-
8
-
9
-
10
-
11
-
12
-
13
-
14
-
15
-
16
-
17
-
 18
18 -
 19
19 -
 20
20 -
 21
21 -
 22
22 -
 23
23 -
 24
24 -
 25
25 -
 26
26 -
 27
27 -
 28
28 -
 29
29 -
 30
30 -
 31
31 -
 32
32 -
 33
33 -
 34
34 -
 35
35 -
 36
36 -
 37
37 -
 38
38 -
39
-
40
-
41
-
42
-
43
-
44
-
45
-
46
-
47
-
48
-
49
-
50
-
51
-
52
-
53
-
54
-
55
-
56
-
57
-
58
-
59
-
60
-
61
-
62
-
63
-
64
-
65
-
66
-
67
-
68
-
69
-
70
-
71
-
72
-
73
-
74
-
75
-
76
-
77
-
78
-
79
-
80
-
81
-
82
-
83
-
84
-
85
-
86
-
87
-
88
-
89
-
90
-
91
-
92
-
93
-
94
-
95
-
96
-
97
-
98
-
99
-
100
-
101
-
102
-
103
-
104
-
105
-
106
-
107
-
108
-
109
-
110
-
111
-
112
-
113
-
114
-
115
-
116
-
117
-
118
-
119
-
120
-
121
-
122
-
123
-
124
-
125
-
126
-
127
-
128
-
129
-
130
-
131
-
132
-
133
-
134
-
135
-
136
-
137
-
138
-
139
-
140
-
141
-
142
-
143
-
144
 |
 |

Table of Contents
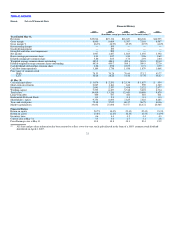
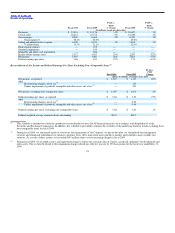
Consolidated Operating Results
Revenues
Fiscal 2010 Fiscal 2009
FY10 vs.
FY09
% Change
FY10 vs.
FY09
% Change
Excluding
Currency
Changes(1) Fiscal 2008
FY09 vs.
FY08
% Change
FY09 vs.
FY08
% Change
Excluding
Currency
Changes(1)
(In millions)
Revenues $ 19,014 $ 19,176 −1% −2% $ 18,627 3% 4%
(1) Results have been restated using exchange rates for the comparative period to enhance the visibility of the underlying business trends excluding the
impact of foreign currency exchange rate fluctuations.
Fiscal 2010 Compared to Fiscal 2009
Excluding the effects of changes in currency exchange rates, revenues for NIKE, Inc. declined 2%, driven primarily by a 2% decline in revenues for
the NIKE Brand. All of our geographies delivered lower revenues with the exception of Emerging Markets, reflecting a challenging economic environment
across most markets, most notably in our Western Europe and Central and Eastern Europe geographies. By product group, revenues for our worldwide
NIKE Brand footwear business were down 1% compared to the prior year. Worldwide NIKE Brand apparel and equipment revenues declined 5% and 7%,
respectively. While our wholesale business remains the largest component of our NIKE Brand revenues, our NIKE−owned retail business continues to
grow, representing approximately 15% of our total NIKE Brand revenues in fiscal 2010 as compared to 13% in fiscal 2009.
Revenues from our Other Businesses were comprised of results from Cole Haan, Converse, Inc., Hurley International, LLC, NIKE Golf and Umbro,
Ltd. Excluding the impact of currency changes, revenues for these businesses increased by 4% for fiscal 2010, driven by increased revenues at Converse,
Umbro and Hurley, which more than offset revenue declines at NIKE Golf and Cole Haan.
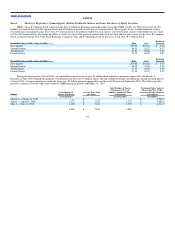
Futures Orders
Translated into US dollars at prior year exchange rates, worldwide futures and advance orders for NIKE Brand footwear and apparel scheduled for
delivery from June through November 2010 were 10% higher than the orders reported for the comparable prior year period. This futures growth was driven
by increases in unit sales volume for our footwear products and growth in average unit price for both of our apparel and footwear products. Futures orders
increased 7% when translated at forecasted exchange rates for the next six months, which approximate current spot rates.
The reported futures and advance orders growth is not necessarily indicative of our expectation of revenue growth during this period. This is due to
year−over−year changes in shipment timing, and because the mix of orders can shift between advance/futures and at−once orders and that the fulfillment of
certain orders may fall outside of the schedule noted above. In addition, exchange rate fluctuations as well as differing levels of order cancellations and
discounts can cause differences in the comparisons between advance/futures orders and actual revenues. Moreover, a significant portion of our revenue is
not derived from futures and advance orders, including at−once and close−out sales of NIKE footwear and apparel, sales of NIKE equipment, sales from our
Other Businesses and certain retail sales across all brands.
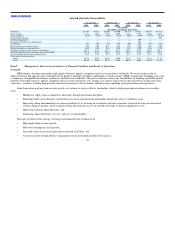
Fiscal 2009 Compared to Fiscal 2008
Excluding the effects of changes in currency exchange rates, revenues for NIKE, Inc. grew 4%, driven primarily by a 4% increase in revenues for the
NIKE Brand. The North America geography contributed nearly 1 percentage point of the consolidated revenue growth for fiscal 2009, while the remaining
geographies contributed
25