Nike 2010 Annual Report Download - page 74
Download and view the complete annual report
Please find page 74 of the 2010 Nike annual report below. You can navigate through the pages in the report by either clicking on the pages listed below, or by using the keyword search tool below to find specific information within the annual report.-
 1
1 -
2
-
3
-
4
-
5
-
6
-
7
-
8
-
9
-
10
-
11
-
12
-
13
-
14
-
15
-
16
-
17
-
18
-
19
-
20
-
21
-
22
-
23
-
24
-
25
-
26
-
27
-
28
-
29
-
30
-
31
-
32
-
33
-
34
-
35
-
36
-
37
-
38
-
39
-
40
-
41
-
42
-
43
-
44
-
45
-
46
-
47
-
48
-
49
-
50
-
51
-
52
-
53
-
54
-
55
-
56
-
57
-
58
-
59
-
60
-
61
-
62
-
63
-
 64
64 -
 65
65 -
 66
66 -
 67
67 -
 68
68 -
 69
69 -
 70
70 -
 71
71 -
 72
72 -
 73
73 -
 74
74 -
 75
75 -
 76
76 -
 77
77 -
 78
78 -
 79
79 -
 80
80 -
 81
81 -
 82
82 -
 83
83 -
 84
84 -
85
-
86
-
87
-
88
-
89
-
90
-
91
-
92
-
93
-
94
-
95
-
96
-
97
-
98
-
99
-
100
-
101
-
102
-
103
-
104
-
105
-
106
-
107
-
108
-
109
-
110
-
111
-
112
-
113
-
114
-
115
-
116
-
117
-
118
-
119
-
120
-
121
-
122
-
123
-
124
-
125
-
126
-
127
-
128
-
129
-
130
-
131
-
132
-
133
-
134
-
135
-
136
-
137
-
138
-
139
-
140
-
141
-
142
-
143
-
144
 |
 |

Table of Contents NIKE, INC.
NOTES TO CONSOLIDATED FINANCIAL STATEMENTS — (Continued)
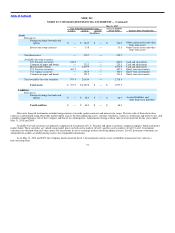
The following table presents information about the Company’s financial assets and liabilities measured at fair value on a recurring basis as of May 31,
2010 and 2009 and indicates the fair value hierarchy of the valuation techniques utilized by the Company to determine such fair value.
May 31, 2010
Fair Value Measurements Using Assets / Liabilities
at Fair Value Balance Sheet Classification
Level 1 Level 2 Level 3
(In millions)
Assets
Derivatives:
Foreign exchange forwards and
options $ — $ 420.2 $ — $ 420.2 Other current assets and other
long−term assets
Interest rate swap contracts — 14.6 14.6 Other current assets and other
long−term assets
Total derivatives — 434.8 — 434.8
Available−for−sale securities:
U.S. Treasury securities 1,231.7 — — 1,231.7 Cash and equivalents
Commercial paper and bonds — 461.9 — 461.9 Cash and equivalents
Money market funds — 684.5 — 684.5 Cash and equivalents
U.S. Treasury securities 1,084.0 — — 1,084.0 Short−term investments
U.S. Agency securities — 298.5 — 298.5 Short−term investments
Commercial paper and bonds — 684.3 — 684.3 Short−term investments
Total available−for−sale securities 2,315.7 2,129.2 — 4,444.9
Total Assets $ 2,315.7 $ 2,564.0 $ — $ 4,879.7
Liabilities
Derivatives:
Foreign exchange forwards and
options $ — $ 165.1 $ — $ 165.1 Accrued liabilities and
other long−term liabilities
Total Liabilities $ — $ 165.1 $ — $ 165.1
71