Nike 2010 Annual Report Download - page 35
Download and view the complete annual report
Please find page 35 of the 2010 Nike annual report below. You can navigate through the pages in the report by either clicking on the pages listed below, or by using the keyword search tool below to find specific information within the annual report.-
 1
1 -
2
-
3
-
4
-
5
-
6
-
7
-
8
-
9
-
10
-
11
-
12
-
13
-
14
-
15
-
16
-
17
-
18
-
19
-
20
-
21
-
22
-
23
-
24
-
 25
25 -
 26
26 -
 27
27 -
 28
28 -
 29
29 -
 30
30 -
 31
31 -
 32
32 -
 33
33 -
 34
34 -
 35
35 -
 36
36 -
 37
37 -
 38
38 -
 39
39 -
 40
40 -
 41
41 -
 42
42 -
 43
43 -
 44
44 -
 45
45 -
46
-
47
-
48
-
49
-
50
-
51
-
52
-
53
-
54
-
55
-
56
-
57
-
58
-
59
-
60
-
61
-
62
-
63
-
64
-
65
-
66
-
67
-
68
-
69
-
70
-
71
-
72
-
73
-
74
-
75
-
76
-
77
-
78
-
79
-
80
-
81
-
82
-
83
-
84
-
85
-
86
-
87
-
88
-
89
-
90
-
91
-
92
-
93
-
94
-
95
-
96
-
97
-
98
-
99
-
100
-
101
-
102
-
103
-
104
-
105
-
106
-
107
-
108
-
109
-
110
-
111
-
112
-
113
-
114
-
115
-
116
-
117
-
118
-
119
-
120
-
121
-
122
-
123
-
124
-
125
-
126
-
127
-
128
-
129
-
130
-
131
-
132
-
133
-
134
-
135
-
136
-
137
-
138
-
139
-
140
-
141
-
142
-
143
-
144
 |
 |

Table of Contents
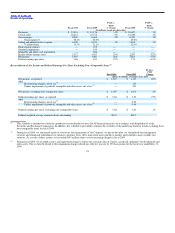
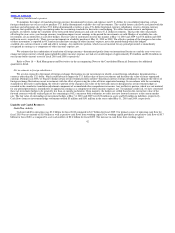
North America apparel revenue during fiscal 2010 was flat when compared to fiscal 2009, which was reflective of a high single−digit percentage
increase in average selling price per unit, offset by a low double−digit percentage decrease in unit sales. Both the increase in average selling price per unit
and the decrease in unit sales were primarily a result of fewer close−out sales compared to the prior year.
For fiscal 2010, the increase in North America’s EBIT was primarily the result of improved gross margins combined with a slight decrease in selling
and administrative expense, driven by a reduction in demand creation expense compared to prior year. The improvement in gross margin was mainly
attributable to a shift in mix from close−out to in−line sales, growth of NIKE−owned retail as a percentage of total sales, improved in−line product margins
and lower warehousing costs. The reduction in demand creation expense was primarily attributable to lower spending on advertising.
Fiscal 2009 Compared to Fiscal 2008
During fiscal 2009, the increase in North America footwear revenue was the result of low single−digit growth in both unit sales and average selling
price per pair. The growth in unit sales was primarily driven by higher demand for our Jordan brand, action sports and kids’ products. The increase in
average selling price per pair was attributable to selective price increases, primarily during the first half of fiscal 2009, and increased sales mix of higher
priced Jordan brand products, partially offset by increased sales mix of kids’ products which are generally lower priced.
The year−over−year decrease in North America apparel revenues during fiscal 2009 reflected a mid single−digit decrease in unit sales, primarily
driven by a reduction in products sold to value channel retailers and generally softer demand in the overall apparel market. Average selling prices increased
slightly as a result of the reduction in products sold to value retailers, mostly offset by an increased mix of close−out sales and higher levels of discounts
provided retailers to manage inventory levels.
EBIT for the North America geography declined in fiscal 2009 as a result of higher operating overhead expense and lower gross margins. The
increase in operating overhead was attributable to investments in NIKE−owned retail. Gross margins decreased as a result of higher warehousing costs,
higher retail inventory markdowns and increased customer discounts provided to manage inventory levels.
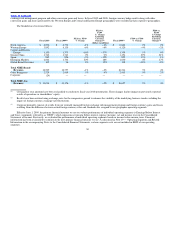
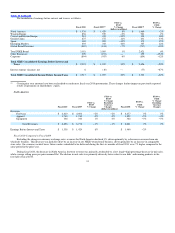
Western Europe
Fiscal 2010 Fiscal 2009
FY10 vs.
FY09
% Change
FY10 vs.
FY09
% Change
Excluding
Currency
Changes Fiscal 2008
FY09 vs.
FY08
% Change
FY09 vs.
FY08
% Change
Excluding
Currency
Changes
(dollars in millions)
Revenues
Footwear $ 2,320 $ 2,385 −3% −3% $ 2,411 −1% 1%
Apparel 1,325 1,463 −9% −9% 1,585 −8% −7%
Equipment 247 291 −15% −15% 324 −10% −9%
Total Revenues $ 3,892 $ 4,139 −6% −6% $ 4,320 −4% −2%
Earnings Before Interest and Taxes $ 856 $ 939 −9% $ 923 2%
Fiscal 2010 Compared to Fiscal 2009
On a currency neutral basis, most markets in Western Europe experienced lower revenues during fiscal 2010, including our largest market, U.K. &
Ireland declined by 4%, reflecting a difficult retail environment
32