Nike 2010 Annual Report Download - page 94
Download and view the complete annual report
Please find page 94 of the 2010 Nike annual report below. You can navigate through the pages in the report by either clicking on the pages listed below, or by using the keyword search tool below to find specific information within the annual report.-
 1
1 -
2
-
3
-
4
-
5
-
6
-
7
-
8
-
9
-
10
-
11
-
12
-
13
-
14
-
15
-
16
-
17
-
18
-
19
-
20
-
21
-
22
-
23
-
24
-
25
-
26
-
27
-
28
-
29
-
30
-
31
-
32
-
33
-
34
-
35
-
36
-
37
-
38
-
39
-
40
-
41
-
42
-
43
-
44
-
45
-
46
-
47
-
48
-
49
-
50
-
51
-
52
-
53
-
54
-
55
-
56
-
57
-
58
-
59
-
60
-
61
-
62
-
63
-
64
-
65
-
66
-
67
-
68
-
69
-
70
-
71
-
72
-
73
-
74
-
75
-
76
-
77
-
78
-
79
-
80
-
81
-
82
-
83
-
 84
84 -
 85
85 -
 86
86 -
 87
87 -
 88
88 -
 89
89 -
 90
90 -
 91
91 -
 92
92 -
 93
93 -
 94
94 -
 95
95 -
 96
96 -
 97
97 -
 98
98 -
 99
99 -
 100
100 -
 101
101 -
 102
102 -
 103
103 -
 104
104 -
105
-
106
-
107
-
108
-
109
-
110
-
111
-
112
-
113
-
114
-
115
-
116
-
117
-
118
-
119
-
120
-
121
-
122
-
123
-
124
-
125
-
126
-
127
-
128
-
129
-
130
-
131
-
132
-
133
-
134
-
135
-
136
-
137
-
138
-
139
-
140
-
141
-
142
-
143
-
144
 |
 |

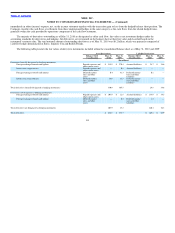
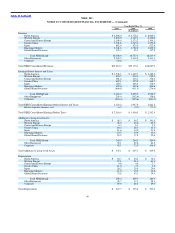
Table of Contents NIKE, INC.
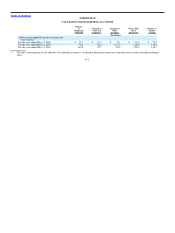
NOTES TO CONSOLIDATED FINANCIAL STATEMENTS — (Continued)
(1) During the year ended May 31, 2009, the Other category included a pre−tax charge of $401.3 million for the impairment of goodwill, intangible and
other assets of Umbro, which was recorded in the third quarter of fiscal 2009. See Note 4 — Acquisition, Identifiable Intangible Assets, Goodwill and
Umbro Impairment for more information.
(2) During the year ended May 31, 2009, Corporate expense included pre−tax charges of $195.0 million for the Company’s restructuring activities, which
were completed in the fourth quarter of fiscal 2009. See Note 16 — Restructuring Charges for more information.
Year Ended May 31,
2010 2009
(In millions)
Accounts Receivable, net
North America $ 848.0 $ 897.7
Western Europe 401.8 508.8
Central and Eastern Europe 293.6 368.3
Greater China 128.9 122.3
Japan 166.8 207.2
Emerging Markets 327.2 268.2
Global Brand Divisions 22.8 53.3
Total NIKE Brand 2,189.1 2,425.8
Other Businesses 442.1 439.7
Corporate 18.6 18.4
Total Accounts Receivable, net $ 2,649.8 $ 2,883.9
Inventories
North America $ 767.5 $ 868.8
Western Europe 347.2 341.6
Central and Eastern Europe 124.8 278.1
Greater China 103.5 110.4
Japan 68.3 95.7
Emerging Markets 262.2 258.2
Global Brand Divisions 20.6 32.4
Total NIKE Brand 1,694.1 1,985.2
Other Businesses 346.7 371.8
Corporate — —
Total Inventories $ 2,040.8 $ 2,357.0
Property, Plant and Equipment, net
North America $ 324.7 $ 354.3
Western Europe 282.1 326.5
Central and Eastern Europe 12.3 15.0
Greater China 145.5 78.2
Japan 332.6 318.5
Emerging Markets 47.0 47.3
Global Brand Divisions 99.6 103.1
Total NIKE Brand 1,243.8 1,242.9
Other Businesses 167.4 163.7
Corporate 520.7 551.1
Total Property, Plant and Equipment, net $ 1,931.9 $ 1,957.7
91