Nike 2010 Annual Report Download - page 34
Download and view the complete annual report
Please find page 34 of the 2010 Nike annual report below. You can navigate through the pages in the report by either clicking on the pages listed below, or by using the keyword search tool below to find specific information within the annual report.-
 1
1 -
2
-
3
-
4
-
5
-
6
-
7
-
8
-
9
-
10
-
11
-
12
-
13
-
14
-
15
-
16
-
17
-
18
-
19
-
20
-
21
-
22
-
23
-
 24
24 -
 25
25 -
 26
26 -
 27
27 -
 28
28 -
 29
29 -
 30
30 -
 31
31 -
 32
32 -
 33
33 -
 34
34 -
 35
35 -
 36
36 -
 37
37 -
 38
38 -
 39
39 -
 40
40 -
 41
41 -
 42
42 -
 43
43 -
 44
44 -
45
-
46
-
47
-
48
-
49
-
50
-
51
-
52
-
53
-
54
-
55
-
56
-
57
-
58
-
59
-
60
-
61
-
62
-
63
-
64
-
65
-
66
-
67
-
68
-
69
-
70
-
71
-
72
-
73
-
74
-
75
-
76
-
77
-
78
-
79
-
80
-
81
-
82
-
83
-
84
-
85
-
86
-
87
-
88
-
89
-
90
-
91
-
92
-
93
-
94
-
95
-
96
-
97
-
98
-
99
-
100
-
101
-
102
-
103
-
104
-
105
-
106
-
107
-
108
-
109
-
110
-
111
-
112
-
113
-
114
-
115
-
116
-
117
-
118
-
119
-
120
-
121
-
122
-
123
-
124
-
125
-
126
-
127
-
128
-
129
-
130
-
131
-
132
-
133
-
134
-
135
-
136
-
137
-
138
-
139
-
140
-
141
-
142
-
143
-
144
 |
 |

Table of Contents
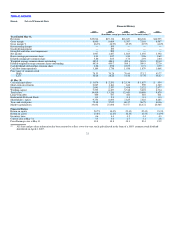
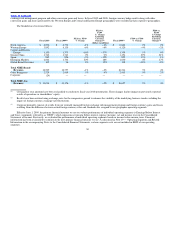
The breakdown of earnings before interest and taxes is as follows:
Fiscal 2010 Fiscal 2009(1)
FY10 vs.
FY09
% Change Fiscal 2008(1)
FY09 vs.
FY08
% Change
(dollars in millions)
North America $ 1,538 $ 1,429 8% $ 1,460 −2%
Western Europe 856 939 −9% 923 2%
Central and Eastern Europe 281 415 −32% 358 16%
Greater China 637 575 11% 431 33%
Japan 180 205 −12% 179 15%
Emerging Markets 493 343 44% 307 12%
Global Brand Divisions (867) (811) −7% (737) −10%
Total NIKE Brand 3,118 3,095 1% 2,921 6%
Other Businesses 299 (193) — 359 −154%
Corporate (894) (955) 6% (854) −12%
Total NIKE Consolidated Earnings Before Interest and
Taxes $ 2,523 $ 1,947 30% $ 2,426 −20%
Interest expense (income), net 6 (10) — (77) −87%
Total NIKE Consolidated Income Before Income Taxes $ 2,517 $ 1,957 29% $ 2,503 −22%
(1) Certain prior year amounts have been reclassified to conform to fiscal year 2010 presentation. These changes had no impact on previously reported
results of operations or shareholders’ equity.
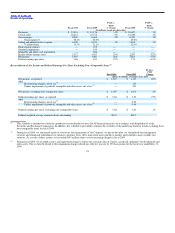
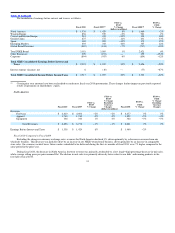
North America
Fiscal 2010 Fiscal 2009
FY10 vs.
FY09
% Change
FY10 vs.
FY09
% Change
Excluding
Currency
Changes Fiscal 2008
FY09 vs.
FY08
% Change
FY09 vs.
FY08
% Change
Excluding
Currency
Changes
(dollars in millions)
Revenues
Footwear $ 4,610 $ 4,694 −2% −2% $ 4,477 5% 5%
Apparel 1,740 1,740 0% 0% 1,822 −5% −4%
Equipment 346 344 1% 0% 362 −5% −5%
Total Revenues $ 6,696 $ 6,778 −1% −1% $ 6,661 2% 2%
Earnings Before Interest and Taxes $ 1,538 $ 1,429 8% $ 1,460 −2%
Fiscal 2010 Compared to Fiscal 2009
Excluding the changes in currency exchange rates, revenues for North America declined 1%, driven primarily by a decrease in revenue from our
wholesale business. This decrease was partially offset by an increase in our NIKE−owned retail business, driven primarily by an increase in comparable
store sales. On a currency neutral basis, futures orders scheduled to be delivered during the first six months of fiscal 2011 were 7% higher compared to the
same period in the prior year.
During fiscal 2010, the decrease in North America footwear revenue was primarily attributable to a low single−digit percentage decrease in unit sales,
while average selling price per pair remained flat. The decline in unit sales was primarily driven by lower sales for our kids’ and running products in the
first half of fiscal 2010.
31