Nike 2010 Annual Report Download - page 82
Download and view the complete annual report
Please find page 82 of the 2010 Nike annual report below. You can navigate through the pages in the report by either clicking on the pages listed below, or by using the keyword search tool below to find specific information within the annual report.-
 1
1 -
2
-
3
-
4
-
5
-
6
-
7
-
8
-
9
-
10
-
11
-
12
-
13
-
14
-
15
-
16
-
17
-
18
-
19
-
20
-
21
-
22
-
23
-
24
-
25
-
26
-
27
-
28
-
29
-
30
-
31
-
32
-
33
-
34
-
35
-
36
-
37
-
38
-
39
-
40
-
41
-
42
-
43
-
44
-
45
-
46
-
47
-
48
-
49
-
50
-
51
-
52
-
53
-
54
-
55
-
56
-
57
-
58
-
59
-
60
-
61
-
62
-
63
-
64
-
65
-
66
-
67
-
68
-
69
-
70
-
71
-
 72
72 -
 73
73 -
 74
74 -
 75
75 -
 76
76 -
 77
77 -
 78
78 -
 79
79 -
 80
80 -
 81
81 -
 82
82 -
 83
83 -
 84
84 -
 85
85 -
 86
86 -
 87
87 -
 88
88 -
 89
89 -
 90
90 -
 91
91 -
 92
92 -
93
-
94
-
95
-
96
-
97
-
98
-
99
-
100
-
101
-
102
-
103
-
104
-
105
-
106
-
107
-
108
-
109
-
110
-
111
-
112
-
113
-
114
-
115
-
116
-
117
-
118
-
119
-
120
-
121
-
122
-
123
-
124
-
125
-
126
-
127
-
128
-
129
-
130
-
131
-
132
-
133
-
134
-
135
-
136
-
137
-
138
-
139
-
140
-
141
-
142
-
143
-
144
 |
 |

Table of Contents NIKE, INC.
NOTES TO CONSOLIDATED FINANCIAL STATEMENTS — (Continued)
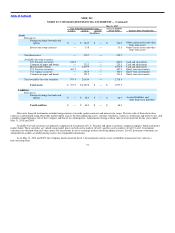
The following table summarizes the Company’s total stock−based compensation expense recognized in selling and administrative expense:
Year Ended May 31,
2010 2009 2008
(In millions)
Stock options(1) $134.6 $128.8 $127.0
ESPPs 13.7 14.4 7.2
Restricted stock 10.7 7.9 6.8
Subtotal 159.0 151.1 141.0
Stock options and restricted stock expense — restructuring(2) — 19.5 —
Total stock−based compensation expense $159.0 $170.6 $141.0
(1) Accelerated stock option expense is recorded for employees eligible for accelerated stock option vesting upon retirement. Accelerated stock option
expense reported during the years ended May 31, 2010, 2009 and 2008 was $74.4 million, $58.7 million and $40.7 million, respectively.
(2) In connection with the restructuring activities that took place during fiscal 2009, the Company recognized stock−based compensation expense relating
to the modification of stock option agreements, allowing for an extended post−termination exercise period, and accelerated vesting of restricted stock
as part of severance packages. See Note 16 — Restructuring Charges for further details.
As of May 31, 2010, the Company had $86.8 million of unrecognized compensation costs from stock options, net of estimated forfeitures, to be
recognized as selling and administrative expense over a weighted average period of 2.2 years.
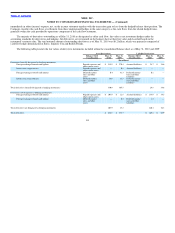
The weighted average fair value per share of the options granted during the years ended May 31, 2010, 2009 and 2008, as computed using the
Black−Scholes pricing model, was $23.43, $17.13 and $13.87, respectively. The weighted average assumptions used to estimate these fair values are as
follows:
Year Ended May 31,
2010 2009 2008
Dividend yield 1.9% 1.5% 1.4%
Expected volatility 57.6% 32.5% 20.0%
Weighted average expected life (in years) 5.0 5.0 5.0
Risk−free interest rate 2.5% 3.4% 4.8%
The Company estimates the expected volatility based on the implied volatility in market traded options on the Company’s common stock with a term
greater than one year, along with other factors. The weighted average expected life of options is based on an analysis of historical and expected future
exercise patterns. The interest rate is based on the U.S. Treasury (constant maturity) risk−free rate in effect at the date of grant for periods corresponding
with the expected term of the options.
79