Nike 2010 Annual Report Download - page 38
Download and view the complete annual report
Please find page 38 of the 2010 Nike annual report below. You can navigate through the pages in the report by either clicking on the pages listed below, or by using the keyword search tool below to find specific information within the annual report.-
 1
1 -
2
-
3
-
4
-
5
-
6
-
7
-
8
-
9
-
10
-
11
-
12
-
13
-
14
-
15
-
16
-
17
-
18
-
19
-
20
-
21
-
22
-
23
-
24
-
25
-
26
-
27
-
 28
28 -
 29
29 -
 30
30 -
 31
31 -
 32
32 -
 33
33 -
 34
34 -
 35
35 -
 36
36 -
 37
37 -
 38
38 -
 39
39 -
 40
40 -
 41
41 -
 42
42 -
 43
43 -
 44
44 -
 45
45 -
 46
46 -
 47
47 -
 48
48 -
49
-
50
-
51
-
52
-
53
-
54
-
55
-
56
-
57
-
58
-
59
-
60
-
61
-
62
-
63
-
64
-
65
-
66
-
67
-
68
-
69
-
70
-
71
-
72
-
73
-
74
-
75
-
76
-
77
-
78
-
79
-
80
-
81
-
82
-
83
-
84
-
85
-
86
-
87
-
88
-
89
-
90
-
91
-
92
-
93
-
94
-
95
-
96
-
97
-
98
-
99
-
100
-
101
-
102
-
103
-
104
-
105
-
106
-
107
-
108
-
109
-
110
-
111
-
112
-
113
-
114
-
115
-
116
-
117
-
118
-
119
-
120
-
121
-
122
-
123
-
124
-
125
-
126
-
127
-
128
-
129
-
130
-
131
-
132
-
133
-
134
-
135
-
136
-
137
-
138
-
139
-
140
-
141
-
142
-
143
-
144
 |
 |

Table of Contents
The year−over−year increase in EBIT for Central and Eastern Europe during fiscal 2009 was primarily driven by higher revenues and improved gross
margin percentage. The gross margin improvement in fiscal 2009 was primarily attributable to improved in−line product margins which more than offset
higher discounts on in−line products and warehousing costs.
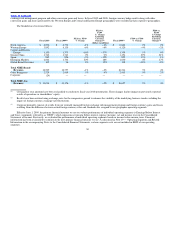
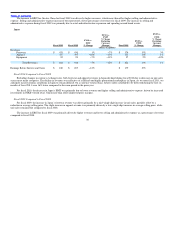
Greater China
Fiscal 2010 Fiscal 2009
FY10 vs.
FY09
% Change
FY10 vs.
FY09
% Change
Excluding
Currency
Changes Fiscal 2008
FY09 vs.
FY08
% Change
FY09 vs.
FY08
% Change
Excluding
Currency
Changes
(dollars in millions)
Revenues
Footwear $ 953 $ 940 1% 1% $ 738 27% 20%
Apparel 684 700 −2% −3% 541 29% 21%
Equipment 105 103 2% 0% 75 37% 32%
Total Revenues $ 1,742 $ 1,743 0% 0% $ 1,354 29% 21%
Earnings Before Interest and Taxes $ 637 $ 575 11% $ 431 33%
Fiscal 2010 Compared to Fiscal 2009
For fiscal 2010, revenues for Greater China were flat, primarily attributable to comparisons against strong revenue growth in the first half of fiscal
2009 driven by the Beijing Olympics. Greater China began to gain momentum in the second half of fiscal 2010, as revenues increased 11% as compared to
the second half of fiscal 2009. On a currency−neutral basis, futures orders scheduled to be delivered during the first six months of fiscal 2011 were 16%
higher compared to the same period in the prior year.
The increase in footwear revenue was primarily driven by a mid single−digit increase in average selling price, partially offset by a mid single−digit
decrease in unit sales. The increase in average selling price was primarily due to strategic product pricing increases, while the decrease in unit sales was
primarily driven by lower discounts on in−line products compared to the prior year.
The decrease in apparel revenue for fiscal 2010 was primarily due to a mid single−digit decrease in unit sales across most major categories, which
more than offset a low single−digit increase in average selling price primarily driven by strategic product pricing increases.
EBIT for Greater China increased at a faster rate than revenue as a result of higher gross margins and reductions in demand creation spending
attributable to comparisons against higher prior year spending around the Beijing Olympics.
Fiscal 2009 Compared to Fiscal 2008
Greater China continued to deliver strong results in fiscal 2009 as revenues increased 21% on a currency−neutral basis, driven by expansion in both
the number of stores selling NIKE products and sales through existing stores. China’s rate of revenue growth slowed to 6% on a currency neutral basis in
the fourth quarter of fiscal 2009 as we lapped very strong growth in the fourth quarter of fiscal 2008.
The increase in both footwear and apparel revenues was driven primarily by a double−digit increase in unit sales. The growth in unit sales was
partially offset by a reduction in average selling price in fiscal 2009, resulting primarily from increased discounts on in−line products provided to retailers to
manage inventory levels.
35