Nike 2010 Annual Report Download - page 88
Download and view the complete annual report
Please find page 88 of the 2010 Nike annual report below. You can navigate through the pages in the report by either clicking on the pages listed below, or by using the keyword search tool below to find specific information within the annual report.-
 1
1 -
2
-
3
-
4
-
5
-
6
-
7
-
8
-
9
-
10
-
11
-
12
-
13
-
14
-
15
-
16
-
17
-
18
-
19
-
20
-
21
-
22
-
23
-
24
-
25
-
26
-
27
-
28
-
29
-
30
-
31
-
32
-
33
-
34
-
35
-
36
-
37
-
38
-
39
-
40
-
41
-
42
-
43
-
44
-
45
-
46
-
47
-
48
-
49
-
50
-
51
-
52
-
53
-
54
-
55
-
56
-
57
-
58
-
59
-
60
-
61
-
62
-
63
-
64
-
65
-
66
-
67
-
68
-
69
-
70
-
71
-
72
-
73
-
74
-
75
-
76
-
77
-
 78
78 -
 79
79 -
 80
80 -
 81
81 -
 82
82 -
 83
83 -
 84
84 -
 85
85 -
 86
86 -
 87
87 -
 88
88 -
 89
89 -
 90
90 -
 91
91 -
 92
92 -
 93
93 -
 94
94 -
 95
95 -
 96
96 -
 97
97 -
 98
98 -
99
-
100
-
101
-
102
-
103
-
104
-
105
-
106
-
107
-
108
-
109
-
110
-
111
-
112
-
113
-
114
-
115
-
116
-
117
-
118
-
119
-
120
-
121
-
122
-
123
-
124
-
125
-
126
-
127
-
128
-
129
-
130
-
131
-
132
-
133
-
134
-
135
-
136
-
137
-
138
-
139
-
140
-
141
-
142
-
143
-
144
 |
 |

Table of Contents NIKE, INC.
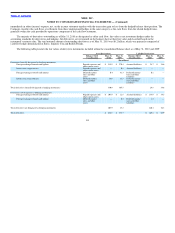
NOTES TO CONSOLIDATED FINANCIAL STATEMENTS — (Continued)
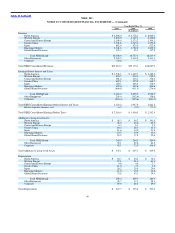
The following tables present the amounts affecting the consolidated statements of income for years ended May 31, 2010 and 2009:
Amount of Gain
(Loss)
Recognized in
Other Comprehensive
Income on Derivatives(1) Amount of Gain (Loss) Reclassified From Accumulated Other
Comprehensive Income into Income(1)
Derivatives formally designated Year Ended
May 31, 2010 Year Ended
May 31, 2009
Location of Gain (Loss) Reclassified
From Accumulated Other
Comprehensive Income
Into Income(1) Year Ended
May 31, 2010 Year Ended
May 31, 2009
(In millions)
Derivatives designated as cash flow
hedges:
Foreign exchange forwards and
options $ (29.9) $ 106.3 Revenue $ 51.4 $ 92.7
Foreign exchange forwards and
options 89.0 350.1 Cost of sales 60.0 (13.5)
Foreign exchange forwards and
options 4.7 (0.4) Selling and
administrative expense 1.0 0.8
Foreign exchange forwards and
options 51.1 165.1 Other (income)
expense, net 56.1 67.8
Total designated cash flow hedges $ 114.9 $ 621.1 $ 168.5 $ 147.8
Derivatives designated as net investment
hedges:
Foreign exchange forwards and
options $ 66.0 $ 161.4 Other (income)
expense, net $ — $ —
(1) For the year ended May 31, 2010, $5.2 million of income was recorded to other (income) expense, net as a result of cash flow hedge ineffectiveness.
For the year ended May 31, 2009, an immaterial amount of ineffectiveness from cash flow hedges was recorded in other (income) expense, net.
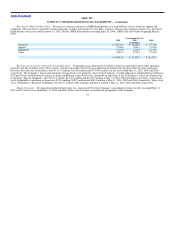
Amount of Gain
(Loss) recognized in
Income on Derivatives
Year Ended
May 31, 2010 Year Ended
May 31, 2009 Location of Gain (Loss) Recognized
in Income on Derivatives
(In millions)
Derivatives designated as fair value hedges:
Interest rate swaps(1) $ 7.4 $ 1.5 Interest expense (income), net
Derivatives not designated as hedging instruments:
Foreign exchange forwards and options $ (91.1) $ (83.0) Other (income) expense, net
(1) All interest rate swap agreements meet the shortcut method requirements under the accounting standards for derivatives and hedging. Accordingly,
changes in the fair values of the interest rate swap agreements are exactly offset by changes in the fair value of the underlying long−term debt. Refer
to section “Fair Value Hedges” for additional detail.
Refer to Note 5 — Accrued Liabilities for derivative instruments recorded in accrued liabilities, Note 6 —Fair Value Measurements for a description
of how the above financial instruments are valued, Note 14 — Accumulated Other Comprehensive Income and the Consolidated Statement of Shareholders’
Equity for additional information on changes in other comprehensive income for the years ended May 31, 2010 and 2009.
85