Nike 2010 Annual Report Download - page 93
Download and view the complete annual report
Please find page 93 of the 2010 Nike annual report below. You can navigate through the pages in the report by either clicking on the pages listed below, or by using the keyword search tool below to find specific information within the annual report.-
 1
1 -
2
-
3
-
4
-
5
-
6
-
7
-
8
-
9
-
10
-
11
-
12
-
13
-
14
-
15
-
16
-
17
-
18
-
19
-
20
-
21
-
22
-
23
-
24
-
25
-
26
-
27
-
28
-
29
-
30
-
31
-
32
-
33
-
34
-
35
-
36
-
37
-
38
-
39
-
40
-
41
-
42
-
43
-
44
-
45
-
46
-
47
-
48
-
49
-
50
-
51
-
52
-
53
-
54
-
55
-
56
-
57
-
58
-
59
-
60
-
61
-
62
-
63
-
64
-
65
-
66
-
67
-
68
-
69
-
70
-
71
-
72
-
73
-
74
-
75
-
76
-
77
-
78
-
79
-
80
-
81
-
82
-
 83
83 -
 84
84 -
 85
85 -
 86
86 -
 87
87 -
 88
88 -
 89
89 -
 90
90 -
 91
91 -
 92
92 -
 93
93 -
 94
94 -
 95
95 -
 96
96 -
 97
97 -
 98
98 -
 99
99 -
 100
100 -
 101
101 -
 102
102 -
 103
103 -
104
-
105
-
106
-
107
-
108
-
109
-
110
-
111
-
112
-
113
-
114
-
115
-
116
-
117
-
118
-
119
-
120
-
121
-
122
-
123
-
124
-
125
-
126
-
127
-
128
-
129
-
130
-
131
-
132
-
133
-
134
-
135
-
136
-
137
-
138
-
139
-
140
-
141
-
142
-
143
-
144
 |
 |

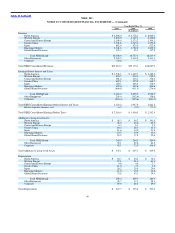
Table of Contents NIKE, INC.
NOTES TO CONSOLIDATED FINANCIAL STATEMENTS — (Continued)
Year Ended May 31,
2010 2009 2008
(In millions)
Revenue
North America $ 6,696.0 $ 6,778.3 $ 6,660.5
Western Europe 3,892.0 4,139.1 4,320.0
Central and Eastern Europe 1,149.9 1,373.2 1,309.2
Greater China 1,741.8 1,743.3 1,353.6
Japan 882.0 925.9 822.4
Emerging Markets 2,041.6 1,702.0 1,630.3
Global Brand Divisions 105.3 95.3 117.9
Total NIKE Brand 16,508.6 16,757.1 16,213.9
Other Businesses 2,529.5 2,419.0 2,413.1
Corporate (24.1) — —
Total NIKE Consolidated Revenues $19,014.0 $19,176.1 $18,627.0
Earnings Before Interest and Taxes
North America $ 1,538.1 $ 1,429.3 $ 1,460.4
Western Europe 855.7 939.1 922.5
Central and Eastern Europe 281.2 415.1 358.4
Greater China 637.1 575.2 430.7
Japan 180.3 205.4 178.9
Emerging Markets 492.6 342.6 306.6
Global Brand Divisions (866.8) (811.5) (736.8)
Total NIKE Brand 3,118.2 3,095.2 2,920.7
Other Businesses(1) 299.4 (192.6) 358.6
Corporate(2) (894.4) (955.6) (853.5)
Total NIKE Consolidated Earnings Before Interest and Taxes 2,523.2 1,947.0 2,425.8
Interest expense (income), net 6.3 (9.5) (77.1)
Total NIKE Consolidated Earnings Before Taxes $ 2,516.9 $ 1,956.5 $ 2,502.9
Additions to Long−lived Assets
North America $ 45.3 $ 99.2 $ 141.9
Western Europe 58.9 69.6 63.5
Central and Eastern Europe 4.3 8.1 5.5
Greater China 80.4 58.5 13.1
Japan 11.6 10.0 21.9
Emerging Markets 10.5 10.9 12.4
Global Brand Divisions 29.9 37.8 22.6
Total NIKE Brand 240.9 294.1 280.9
Other Businesses 52.1 89.6 61.5
Corporate 42.1 72.0 106.8
Total Additions to Long−lived Assets $ 335.1 $ 455.7 $ 449.2
Depreciation
North America $ 64.7 $ 64.3 $ 52.4
Western Europe 57.1 51.4 61.1
Central and Eastern Europe 4.6 4.0 3.7
Greater China 11.0 7.2 3.8
Japan 26.2 29.9 20.4
Emerging Markets 11.0 10.2 10.8
Global Brand Divisions 33.8 42.3 34.3
Total NIKE Brand 208.4 209.3 186.5
Other Businesses 45.7 37.5 28.1
Corporate 69.6 88.2 89.0
Total Depreciation $ 323.7 $ 335.0 $ 303.6
90