Nike 2010 Annual Report Download - page 95
Download and view the complete annual report
Please find page 95 of the 2010 Nike annual report below. You can navigate through the pages in the report by either clicking on the pages listed below, or by using the keyword search tool below to find specific information within the annual report.-
 1
1 -
2
-
3
-
4
-
5
-
6
-
7
-
8
-
9
-
10
-
11
-
12
-
13
-
14
-
15
-
16
-
17
-
18
-
19
-
20
-
21
-
22
-
23
-
24
-
25
-
26
-
27
-
28
-
29
-
30
-
31
-
32
-
33
-
34
-
35
-
36
-
37
-
38
-
39
-
40
-
41
-
42
-
43
-
44
-
45
-
46
-
47
-
48
-
49
-
50
-
51
-
52
-
53
-
54
-
55
-
56
-
57
-
58
-
59
-
60
-
61
-
62
-
63
-
64
-
65
-
66
-
67
-
68
-
69
-
70
-
71
-
72
-
73
-
74
-
75
-
76
-
77
-
78
-
79
-
80
-
81
-
82
-
83
-
84
-
 85
85 -
 86
86 -
 87
87 -
 88
88 -
 89
89 -
 90
90 -
 91
91 -
 92
92 -
 93
93 -
 94
94 -
 95
95 -
 96
96 -
 97
97 -
 98
98 -
 99
99 -
 100
100 -
 101
101 -
 102
102 -
 103
103 -
 104
104 -
 105
105 -
106
-
107
-
108
-
109
-
110
-
111
-
112
-
113
-
114
-
115
-
116
-
117
-
118
-
119
-
120
-
121
-
122
-
123
-
124
-
125
-
126
-
127
-
128
-
129
-
130
-
131
-
132
-
133
-
134
-
135
-
136
-
137
-
138
-
139
-
140
-
141
-
142
-
143
-
144
 |
 |

Table of Contents NIKE, INC.
NOTES TO CONSOLIDATED FINANCIAL STATEMENTS — (Continued)
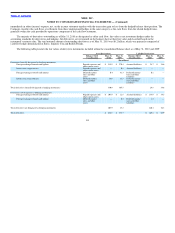
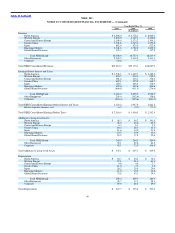
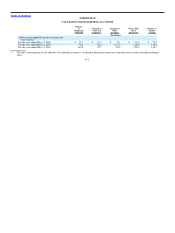
Revenues by Major Product Lines. Revenues to external customers for NIKE Brand products are attributable to sales of footwear, apparel and
equipment. Other revenues to external customers primarily include external sales by Cole Haan, Converse, Exeter (whose primary business was the Starter
brand business which was sold December 17, 2007), Hurley, NIKE Bauer Hockey (through April 16, 2008), NIKE Golf, and Umbro (beginning March 3,
2008).
Year Ended May 31,
2010 2009 2008
(In millions)
Footwear $ 10,333.1 $ 10,306.7 $ 9,731.6
Apparel 5,036.6 5,244.7 5,234.0
Equipment 1,033.6 1,110.4 1,130.4
Other 2,610.7 2,514.3 2,531.0
$ 19,014.0 $ 19,176.1 $ 18,627.0
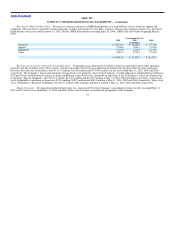
Revenues and Long−Lived Assets by Geographic Area. Geographical area information is similar to what was shown previously under operating
segments with the exception of the Other activity, which has been allocated to the geographical areas based on the location where the sales originated.
Revenues derived in the United States were $7,913.9 million, $8,019.8 million and $7,938.5 million, for the years ended May 31, 2010, 2009 and 2008,
respectively. The Company’s largest concentrations of long−lived assets primarily consist of the Company’s world headquarters and distribution facilities in
the United States and distribution facilities in Japan and Belgium. Long−lived assets attributable to operations in the United States, which are comprised of
net property, plant & equipment, were $1,070.1 million, $1,142.6 million and $1,109.9 million at May 31, 2010, 2009 and 2008, respectively. Long−lived
assets attributable to operations in Japan were $335.6 million, $322.3 million and $303.8 million at May 31, 2010, 2009 and 2008, respectively. Long−lived
assets attributable to operations in Belgium were $163.7 million, $191.0 million and $219.1 million at May 31, 2010, 2009 and 2008, respectively.
Major Customers. Revenues derived from Foot Locker, Inc. represented 8% of the Company’s consolidated revenues for the year ended May 31,
2010 and 9% for the years ended May 31, 2009 and 2008. Sales to this customer are included in all segments of the Company.
92