Nike 2010 Annual Report Download - page 75
Download and view the complete annual report
Please find page 75 of the 2010 Nike annual report below. You can navigate through the pages in the report by either clicking on the pages listed below, or by using the keyword search tool below to find specific information within the annual report.-
 1
1 -
2
-
3
-
4
-
5
-
6
-
7
-
8
-
9
-
10
-
11
-
12
-
13
-
14
-
15
-
16
-
17
-
18
-
19
-
20
-
21
-
22
-
23
-
24
-
25
-
26
-
27
-
28
-
29
-
30
-
31
-
32
-
33
-
34
-
35
-
36
-
37
-
38
-
39
-
40
-
41
-
42
-
43
-
44
-
45
-
46
-
47
-
48
-
49
-
50
-
51
-
52
-
53
-
54
-
55
-
56
-
57
-
58
-
59
-
60
-
61
-
62
-
63
-
64
-
 65
65 -
 66
66 -
 67
67 -
 68
68 -
 69
69 -
 70
70 -
 71
71 -
 72
72 -
 73
73 -
 74
74 -
 75
75 -
 76
76 -
 77
77 -
 78
78 -
 79
79 -
 80
80 -
 81
81 -
 82
82 -
 83
83 -
 84
84 -
 85
85 -
86
-
87
-
88
-
89
-
90
-
91
-
92
-
93
-
94
-
95
-
96
-
97
-
98
-
99
-
100
-
101
-
102
-
103
-
104
-
105
-
106
-
107
-
108
-
109
-
110
-
111
-
112
-
113
-
114
-
115
-
116
-
117
-
118
-
119
-
120
-
121
-
122
-
123
-
124
-
125
-
126
-
127
-
128
-
129
-
130
-
131
-
132
-
133
-
134
-
135
-
136
-
137
-
138
-
139
-
140
-
141
-
142
-
143
-
144
 |
 |
Table of Contents NIKE, INC.
NOTES TO CONSOLIDATED FINANCIAL STATEMENTS — (Continued)
May 31, 2009
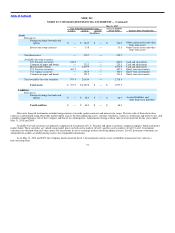
Fair Value Measurements Using Assets / Liabilities
at Fair Value Balance Sheet Classification
Level 1 Level 2 Level 3
(In millions)
Assets
Derivatives:
Foreign exchange forwards and
options $ — $ 364.9 $ — $ 364.9 Other current assets and other
long−term assets
Interest rate swap contracts — 13.8 — 13.8 Other current assets and other
long−term assets
Total derivatives — 378.7 — 378.7
Available−for−sale securities:
U.S. Treasury securities 240.0 — — 240.0 Cash and equivalents
Commercial paper and bonds — 235.3 — 235.3 Cash and equivalents
Money market funds — 1,079.5 — 1,079.5 Cash and equivalents
U.S. Treasury securities 467.9 — — 467.9 Short−term investments
U.S. Agency securities — 304.9 — 304.9 Short−term investments
Commercial paper and bonds — 391.2 — 391.2 Short−term investments
Total available−for−sale securities 707.9 2,010.9 — 2,718.8
Total Assets $ 707.9 $ 2,389.6 $ — $ 3,097.5
Liabilities
Derivatives:
Foreign exchange forwards and
options $ — $ 68.9 $ — $ 68.9 Accrued liabilities and
other long−term liabilities
Total Liabilities $ — $ 68.9 $ — $ 68.9
Derivative financial instruments include foreign currency forwards, option contracts and interest rate swaps. The fair value of these derivatives
contracts is determined using observable market inputs such as the forward pricing curve, currency volatilities, currency correlations and interest rates, and
considers nonperformance risk of the Company and that of its counterparties. Adjustments relating to these risks were not material for the years ended
May 31, 2010 and 2009.
Available−for−sale securities are primarily comprised of investments in U.S. Treasury and agency securities, commercial paper, bonds and money
market funds. These securities are valued using market prices on both active markets (level 1) and less active markets (level 2). Level 1 instrument
valuations are obtained from real−time quotes for transactions in active exchange markets involving identical assets. Level 2 instrument valuations are
obtained from readily−available pricing sources for comparable instruments.
As of May 31, 2010 and 2009, the Company had no material Level 3 measurements and no assets or liabilities measured at fair value on a
non−recurring basis.
72