Nike 2010 Annual Report Download - page 30
Download and view the complete annual report
Please find page 30 of the 2010 Nike annual report below. You can navigate through the pages in the report by either clicking on the pages listed below, or by using the keyword search tool below to find specific information within the annual report.-
 1
1 -
2
-
3
-
4
-
5
-
6
-
7
-
8
-
9
-
10
-
11
-
12
-
13
-
14
-
15
-
16
-
17
-
18
-
19
-
 20
20 -
 21
21 -
 22
22 -
 23
23 -
 24
24 -
 25
25 -
 26
26 -
 27
27 -
 28
28 -
 29
29 -
 30
30 -
 31
31 -
 32
32 -
 33
33 -
 34
34 -
 35
35 -
 36
36 -
 37
37 -
 38
38 -
 39
39 -
 40
40 -
41
-
42
-
43
-
44
-
45
-
46
-
47
-
48
-
49
-
50
-
51
-
52
-
53
-
54
-
55
-
56
-
57
-
58
-
59
-
60
-
61
-
62
-
63
-
64
-
65
-
66
-
67
-
68
-
69
-
70
-
71
-
72
-
73
-
74
-
75
-
76
-
77
-
78
-
79
-
80
-
81
-
82
-
83
-
84
-
85
-
86
-
87
-
88
-
89
-
90
-
91
-
92
-
93
-
94
-
95
-
96
-
97
-
98
-
99
-
100
-
101
-
102
-
103
-
104
-
105
-
106
-
107
-
108
-
109
-
110
-
111
-
112
-
113
-
114
-
115
-
116
-
117
-
118
-
119
-
120
-
121
-
122
-
123
-
124
-
125
-
126
-
127
-
128
-
129
-
130
-
131
-
132
-
133
-
134
-
135
-
136
-
137
-
138
-
139
-
140
-
141
-
142
-
143
-
144
 |
 |

Table of Contents
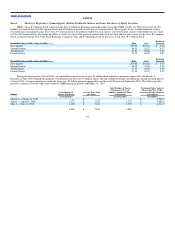
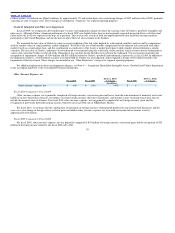
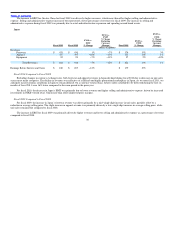
Selling and Administrative Expense
Fiscal 2010 Fiscal 2009 FY10 vs. FY09
% Change Fiscal 2008 FY09 vs. FY08
% Change
(In millions)
Operating overhead expense $ 3,970 $ 3,798 5% $ 3,645 4%
Demand creation expense(1) 2,356 2,352 0% 2,309 2%
Selling and administrative expense $ 6,326 $ 6,150 3% $ 5,954 3%
% of Revenues 33.3% 32.1% 120 bps 32.0% 10 bps
(1) Demand creation consists of advertising and promotion expenses, including costs of endorsement contracts.
Fiscal 2010 Compared to Fiscal 2009
Changes in foreign currency exchange rates increased selling and administrative expense by 1 percentage point in fiscal 2010.
Excluding changes in exchange rates, operating overhead expense increased 4% compared to the prior year due primarily to increases in
performance−based compensation and investments in NIKE−owned retail. These increases were partially offset by reductions in compensation spending in
fiscal 2010 as a result of restructuring activities that took place in the fourth quarter of fiscal 2009.
In fiscal 2010, changes in currency exchange rates had a minimal impact on demand creation expense. Demand creation expense remained flat
compared to the prior year, as increases in sports marketing and digital marketing expenses were offset by reductions in advertising.
In fiscal 2011, we will continue to focus our resources on those investments that drive sustainable and profitable growth. We expect demand creation
will increase at a slightly slower rate than revenues, with spending weighted toward the first quarter driven by key events including the 2010 World Cup.
We anticipate operating overhead will grow at a mid single−digit rate, with faster growth in the first half of the fiscal year, driven by increased investments
in our NIKE−owned retail business.
Fiscal 2009 Compared to Fiscal 2008
Changes in foreign currency exchange rates decreased selling and administrative expense by 2 percentage points in fiscal 2009. Excluding changes in
exchange rates, operating overhead increased 6% during fiscal 2009. The increase in operating overhead was primarily attributable to investments in growth
drivers such as NIKE−owned retail in the North America, Western Europe, Greater China, and Japan geographies, infrastructure for the Emerging Markets
and Central and Eastern Europe geographies as well as for our non−NIKE Brand businesses, which more than offset steps taken to reduce operating
overhead spending, including implementation of a hiring freeze and reductions in spending for travel and meetings.
On a constant−currency basis, demand creation expense increased 3% during fiscal 2009. Demand creation spending decreased in the second half of
fiscal 2009 as a result of actions taken to reduce spending across nearly all demand creation related activities, most notably traditional media and print
advertising. The increase in demand creation during the first half of fiscal 2009 was primarily attributable to strategic investments, including first quarter
spending around the Beijing Summer Olympics and the European Football Championships, and increased investments in athlete and team endorsements
across all geographies.
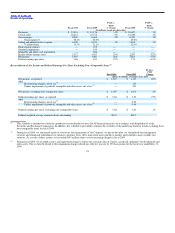
Restructuring Charges
During fiscal 2009, we restructured the organization to streamline our management structure, enhance consumer focus, drive innovation more quickly
to market and establish a more scalable cost structure. As a result
27