Nike 2010 Annual Report Download - page 40
Download and view the complete annual report
Please find page 40 of the 2010 Nike annual report below. You can navigate through the pages in the report by either clicking on the pages listed below, or by using the keyword search tool below to find specific information within the annual report.-
 1
1 -
2
-
3
-
4
-
5
-
6
-
7
-
8
-
9
-
10
-
11
-
12
-
13
-
14
-
15
-
16
-
17
-
18
-
19
-
20
-
21
-
22
-
23
-
24
-
25
-
26
-
27
-
28
-
29
-
 30
30 -
 31
31 -
 32
32 -
 33
33 -
 34
34 -
 35
35 -
 36
36 -
 37
37 -
 38
38 -
 39
39 -
 40
40 -
 41
41 -
 42
42 -
 43
43 -
 44
44 -
 45
45 -
 46
46 -
 47
47 -
 48
48 -
 49
49 -
 50
50 -
51
-
52
-
53
-
54
-
55
-
56
-
57
-
58
-
59
-
60
-
61
-
62
-
63
-
64
-
65
-
66
-
67
-
68
-
69
-
70
-
71
-
72
-
73
-
74
-
75
-
76
-
77
-
78
-
79
-
80
-
81
-
82
-
83
-
84
-
85
-
86
-
87
-
88
-
89
-
90
-
91
-
92
-
93
-
94
-
95
-
96
-
97
-
98
-
99
-
100
-
101
-
102
-
103
-
104
-
105
-
106
-
107
-
108
-
109
-
110
-
111
-
112
-
113
-
114
-
115
-
116
-
117
-
118
-
119
-
120
-
121
-
122
-
123
-
124
-
125
-
126
-
127
-
128
-
129
-
130
-
131
-
132
-
133
-
134
-
135
-
136
-
137
-
138
-
139
-
140
-
141
-
142
-
143
-
144
 |
 |

Table of Contents
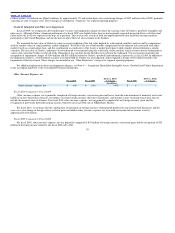
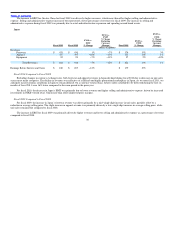
Emerging Markets
Fiscal 2010 Fiscal 2009
FY10 vs.
FY09
% Change
FY10 vs.
FY09
% Change
Excluding
Currency
Changes Fiscal 2008
FY09 vs.
FY08
% Change
FY09 vs.
FY08
% Change
Excluding
Currency
Changes
(dollars in millions)
Revenues
Footwear $ 1,356 $ 1,106 23% 21% $ 1,031 7% 20%
Apparel 532 438 21% 19% 436 0% 14%
Equipment 154 158 −3% −4% 163 −3% 8%
Total Revenues $ 2,042 $ 1,702 20% 18% $ 1,630 4% 17%
Earnings Before Interest and Taxes $ 493 $ 343 44% $ 307 12%
Fiscal 2010 Compared to Fiscal 2009
Excluding changes in currency exchange rates, all markets in the Emerging Markets geography reported revenue growth for fiscal 2010, most notably
Brazil, Mexico and Korea, driven by sales growth in all product categories. Futures orders scheduled to be delivered during the first six months of fiscal
2011 increased 30% on a currency neutral basis.
Footwear revenue growth was primarily driven by a double−digit growth in unit sales and a mid single−digit increase in average selling price per pair
during fiscal 2010, reflective of strong demand for most NIKE Brand product categories in all markets within the geography.
For fiscal 2010, the increase in Emerging Markets’ EBIT was primarily the result of revenue growth combined with lower selling and administrative
expense, which more than offset a decrease in gross margin percentage. The decrease in selling and administrative expense was primarily due to lower
operating overhead expense resulting from fiscal 2009 restructuring activities. The decline in gross margin was primarily due to less favorable
year−over−year standard currency rates assigned to the geography, which more than offset improved in−line product margins.
Fiscal 2009 Compared to Fiscal 2008
Excluding changes in foreign currency exchange rates, most markets in the Emerging Markets geography reported revenue growth in fiscal 2009, led
by Brazil, Argentina and Mexico.
The increase in footwear revenue was primarily driven by a double−digit increase in unit sales, partially offset by a low−single digit reduction in
average selling price.
The increase in EBIT for fiscal 2009 was primarily the result of revenue growth and lower selling and administrative expense. The decrease in selling
and administrative expense was mainly driven by a reduction in spending around advertising and sports marketing.
37