Nike 2010 Annual Report Download - page 25
Download and view the complete annual report
Please find page 25 of the 2010 Nike annual report below. You can navigate through the pages in the report by either clicking on the pages listed below, or by using the keyword search tool below to find specific information within the annual report.-
 1
1 -
2
-
3
-
4
-
5
-
6
-
7
-
8
-
9
-
10
-
11
-
12
-
13
-
14
-
 15
15 -
 16
16 -
 17
17 -
 18
18 -
 19
19 -
 20
20 -
 21
21 -
 22
22 -
 23
23 -
 24
24 -
 25
25 -
 26
26 -
 27
27 -
 28
28 -
 29
29 -
 30
30 -
 31
31 -
 32
32 -
 33
33 -
 34
34 -
 35
35 -
36
-
37
-
38
-
39
-
40
-
41
-
42
-
43
-
44
-
45
-
46
-
47
-
48
-
49
-
50
-
51
-
52
-
53
-
54
-
55
-
56
-
57
-
58
-
59
-
60
-
61
-
62
-
63
-
64
-
65
-
66
-
67
-
68
-
69
-
70
-
71
-
72
-
73
-
74
-
75
-
76
-
77
-
78
-
79
-
80
-
81
-
82
-
83
-
84
-
85
-
86
-
87
-
88
-
89
-
90
-
91
-
92
-
93
-
94
-
95
-
96
-
97
-
98
-
99
-
100
-
101
-
102
-
103
-
104
-
105
-
106
-
107
-
108
-
109
-
110
-
111
-
112
-
113
-
114
-
115
-
116
-
117
-
118
-
119
-
120
-
121
-
122
-
123
-
124
-
125
-
126
-
127
-
128
-
129
-
130
-
131
-
132
-
133
-
134
-
135
-
136
-
137
-
138
-
139
-
140
-
141
-
142
-
143
-
144
 |
 |

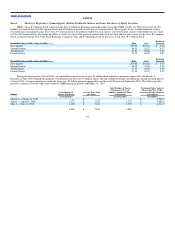
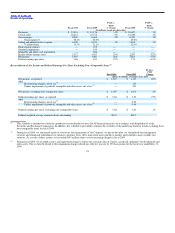
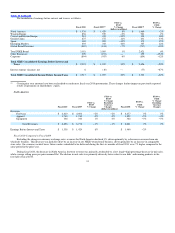
Table of Contents Selected Quarterly Financial Data
1st Quarter 2nd Quarter 3rd Quarter 4th Quarter
2010 2009 2010 2009 2010 2009 2010 2009
(Unaudited)
(In millions, except per share data)
Revenues $4,799 $5,432 $4,406 $4,590 $4,733 $4,441 $5,077 $4,713
Gross margin 2,216 2,562 1,961 2,050 2,218 1,949 2,406 2,044
Gross margin % 46.2% 47.2% 44.5% 44.7% 46.9% 43.9% 47.4% 43.4%
Restructuring charges — — — — — — — 195
Goodwill impairment — — — — — 199 — —
Intangible and other asset impairment — — — — — 202 — —
Net income 513 511 375 391 496 244 522 341
Basic earnings per common share 1.06 1.05 0.77 0.81 1.02 0.50 1.08 0.70
Diluted earnings per common share 1.04 1.03 0.76 0.80 1.01 0.50 1.06 0.70
Weighted average common shares outstanding 485.8 487.2 487.2 483.7 484.4 484.0 484.4 484.8
Diluted weighted average common shares outstanding 491.6 494.9 494.5 489.8 492.3 488.1 493.9 489.4
Cash dividends declared per common share 0.25 0.23 0.27 0.25 0.27 0.25 0.27 0.25
Price range of common stock
High 59.95 70.28 66.35 68.00 67.85 57.33 78.55 57.14
Low 50.16 54.64 53.22 42.68 60.89 40.08 66.99 38.24
Item 7. Management’s Discussion and Analysis of Financial Condition and Results of Operations
Overview
NIKE designs, develops and markets high quality footwear, apparel, equipment and accessory products worldwide. We are the largest seller of
athletic footwear and apparel in the world and sell our products primarily through a combination of retail accounts, NIKE−owned retail, including stores and
e−commerce, independent distributors, franchisees and licensees worldwide. Our goal is to deliver value to our shareholders by building a profitable global
portfolio of branded footwear, apparel, equipment and accessories businesses. Our strategy is to achieve long−term revenue growth by creating innovative,
“must have” products, building deep personal consumer connections with our brands, and delivering compelling retail presentation and experiences.
Aside from achieving long−term revenue growth, we continue to strive to deliver shareholder value by driving operating excellence in several key
areas:
• Making our supply chain a competitive advantage, through operational discipline,
• Reducing product costs through a continued focus on lean manufacturing and product design that strives to eliminate waste,
• Improving selling and administrative expense productivity by focusing on investments that drive economic returns in the form of incremental
revenue and gross margin, and leveraging existing infrastructure across our portfolio of brands to eliminate duplicative costs,
• Improving working capital efficiency, and
• Deploying capital effectively to create value for our shareholders.
Through execution of this strategy, our long−term financial goals continue to be:
• High single−digit revenue growth,
• Mid−teens earnings per share growth,
• Increased return on invested capital and accelerated cash flows, and
• Consistent results through effective management of our diversified portfolio of businesses.
22