Nike 2010 Annual Report Download - page 84
Download and view the complete annual report
Please find page 84 of the 2010 Nike annual report below. You can navigate through the pages in the report by either clicking on the pages listed below, or by using the keyword search tool below to find specific information within the annual report.-
 1
1 -
2
-
3
-
4
-
5
-
6
-
7
-
8
-
9
-
10
-
11
-
12
-
13
-
14
-
15
-
16
-
17
-
18
-
19
-
20
-
21
-
22
-
23
-
24
-
25
-
26
-
27
-
28
-
29
-
30
-
31
-
32
-
33
-
34
-
35
-
36
-
37
-
38
-
39
-
40
-
41
-
42
-
43
-
44
-
45
-
46
-
47
-
48
-
49
-
50
-
51
-
52
-
53
-
54
-
55
-
56
-
57
-
58
-
59
-
60
-
61
-
62
-
63
-
64
-
65
-
66
-
67
-
68
-
69
-
70
-
71
-
72
-
73
-
 74
74 -
 75
75 -
 76
76 -
 77
77 -
 78
78 -
 79
79 -
 80
80 -
 81
81 -
 82
82 -
 83
83 -
 84
84 -
 85
85 -
 86
86 -
 87
87 -
 88
88 -
 89
89 -
 90
90 -
 91
91 -
 92
92 -
 93
93 -
 94
94 -
95
-
96
-
97
-
98
-
99
-
100
-
101
-
102
-
103
-
104
-
105
-
106
-
107
-
108
-
109
-
110
-
111
-
112
-
113
-
114
-
115
-
116
-
117
-
118
-
119
-
120
-
121
-
122
-
123
-
124
-
125
-
126
-
127
-
128
-
129
-
130
-
131
-
132
-
133
-
134
-
135
-
136
-
137
-
138
-
139
-
140
-
141
-
142
-
143
-
144
 |
 |

Table of Contents NIKE, INC.
NOTES TO CONSOLIDATED FINANCIAL STATEMENTS — (Continued)
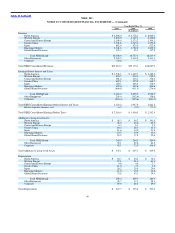
Note 12 — Earnings Per Share
The following is a reconciliation from basic earnings per share to diluted earnings per share. Options to purchase an additional 0.2 million,
13.2 million and 6.6 million shares of common stock were outstanding at May 31, 2010, 2009 and 2008, respectively, but were not included in the
computation of diluted earnings per share because the options were anti−dilutive.
Year Ended May 31,
2010 2009 2008
(In millions, except per share data)
Determination of shares:
Weighted average common shares outstanding 485.5 484.9 495.6
Assumed conversion of dilutive stock options and awards 8.4 5.8 8.5
Diluted weighted average common shares outstanding 493.9 490.7 504.1
Basic earnings per common share $ 3.93 $ 3.07 $ 3.80
Diluted earnings per common share $ 3.86 $ 3.03 $ 3.74
Note 13 — Benefit Plans
The Company has a profit sharing plan available to most U.S.−based employees. The terms of the plan call for annual contributions by the Company
as determined by the Board of Directors. A subsidiary of the Company also has a profit sharing plan available to its U.S.−based employees. The terms of the
plan call for annual contributions as determined by the subsidiary’s executive management. Contributions of $34.9 million, $27.6 million and $37.3 million
were made to the plans and are included in selling and administrative expense for the years ended May 31, 2010, 2009 and 2008, respectively. The
Company has various 401(k) employee savings plans available to U.S.−based employees. The Company matches a portion of employee contributions with
common stock or cash. Company contributions to the savings plans were $34.2 million, $37.6 million and $33.9 million for the years ended May 31, 2010,
2009 and 2008, respectively, and are included in selling and administrative expense.
The Company also has a Long−Term Incentive Plan (“LTIP”) that was adopted by the Board of Directors and approved by shareholders in September
1997 and later amended in fiscal 2007. The Company recognized $24.1 million, $17.6 million and $35.9 million of selling and administrative expense
related to cash awards under the LTIP during the years ended May 31, 2010, 2009 and 2008, respectively.
The Company has pension plans in various countries worldwide. The pension plans are only available to local employees and are generally
government mandated. The liability related to the unfunded pension liabilities of the plans was $113.0 million and $82.8 million at May 31, 2010 and 2009,
respectively.
81