Nike 2010 Annual Report Download - page 27
Download and view the complete annual report
Please find page 27 of the 2010 Nike annual report below. You can navigate through the pages in the report by either clicking on the pages listed below, or by using the keyword search tool below to find specific information within the annual report.-
 1
1 -
2
-
3
-
4
-
5
-
6
-
7
-
8
-
9
-
10
-
11
-
12
-
13
-
14
-
15
-
16
-
 17
17 -
 18
18 -
 19
19 -
 20
20 -
 21
21 -
 22
22 -
 23
23 -
 24
24 -
 25
25 -
 26
26 -
 27
27 -
 28
28 -
 29
29 -
 30
30 -
 31
31 -
 32
32 -
 33
33 -
 34
34 -
 35
35 -
 36
36 -
 37
37 -
38
-
39
-
40
-
41
-
42
-
43
-
44
-
45
-
46
-
47
-
48
-
49
-
50
-
51
-
52
-
53
-
54
-
55
-
56
-
57
-
58
-
59
-
60
-
61
-
62
-
63
-
64
-
65
-
66
-
67
-
68
-
69
-
70
-
71
-
72
-
73
-
74
-
75
-
76
-
77
-
78
-
79
-
80
-
81
-
82
-
83
-
84
-
85
-
86
-
87
-
88
-
89
-
90
-
91
-
92
-
93
-
94
-
95
-
96
-
97
-
98
-
99
-
100
-
101
-
102
-
103
-
104
-
105
-
106
-
107
-
108
-
109
-
110
-
111
-
112
-
113
-
114
-
115
-
116
-
117
-
118
-
119
-
120
-
121
-
122
-
123
-
124
-
125
-
126
-
127
-
128
-
129
-
130
-
131
-
132
-
133
-
134
-
135
-
136
-
137
-
138
-
139
-
140
-
141
-
142
-
143
-
144
 |
 |

Table of Contents
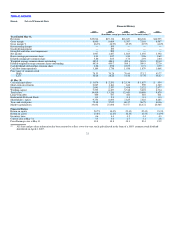
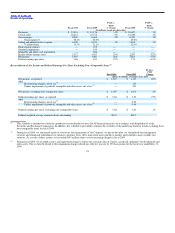
Results of Operations
Fiscal 2010 Fiscal 2009
FY10 vs.
FY09
% Change Fiscal 2008
FY09 vs.
FY08
% Change
(In millions, except per share data)
Revenues $ 19,014 $ 19,176 −1% $ 18,627 3%
Cost of sales 10,214 10,572 −3% 10,240 3%
Gross margin 8,800 8,604 2% 8,387 3%
Gross margin % 46.3% 44.9% 45.0%
Selling and administrative expense 6,326 6,150 3% 5,954 3%
% of Revenues 33.3% 32.1% 32.0%
Restructuring charges — 195 — — —
Goodwill impairment — 199 — — —
Intangible and other asset impairment — 202 — — —
Income before income taxes 2,517 1,957 29% 2,503 −22%
Net income 1,907 1,487 28% 1,883 −21%
Diluted earnings per share 3.86 3.03 27% 3.74 −19%
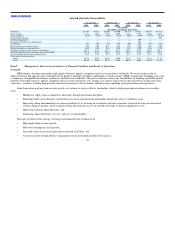
Reconciliation of Net Income and Diluted Earnings Per Share Excluding Non−Comparable Items (1)
Fiscal 2010 Fiscal 2009
FY10 vs.
FY09
Change
(dollars in millions, except per share data)
Net income, as reported $ 1,907 $ 1,487 28%
Add: Restructuring charges, net of tax(2) — 145
Umbro impairment of goodwill, intangible and other assets, net of tax(3) — 241
Net income, excluding non−comparable items $ 1,907 $ 1,873 2%
Diluted earnings per share, as reported $ 3.86 $ 3.03 27%
Add: Restructuring charges, net of tax(2) — 0.29
Umbro impairment of goodwill, intangible and other assets, net of tax(3) — 0.49
Diluted earnings per share, excluding non−comparable items $ 3.86 $ 3.81 1%
Diluted weighted average common shares outstanding 493.9 490.7
(1) This schedule is intended to satisfy the quantitative reconciliation for non−GAAP financial measures in accordance with Regulation G of the
Securities and Exchange Commission. In addition, this schedule is provided to enhance the visibility of the underlying business trends excluding these
non−comparable items for fiscal 2009.
(2) During fiscal 2009, we announced a plan to restructure the organization of the Company. As part of this plan, we streamlined our management
structure and eliminated redundancies to enhance consumer focus, drive innovation more quickly to market, and establish a more scalable cost
structure. As a result of these actions, we recorded $195 million of pre−tax restructuring charges in fiscal 2009.
(3) During fiscal 2009, we recorded a non−cash impairment charge to reduce the carrying value of Umbro’s goodwill, indefinite−lived trademark and
other assets. The tax benefit related to this impairment charge reduced our effective tax rate by 250 basis points for the fiscal year ended May 31,
2009.
24