Nike 2010 Annual Report Download - page 39
Download and view the complete annual report
Please find page 39 of the 2010 Nike annual report below. You can navigate through the pages in the report by either clicking on the pages listed below, or by using the keyword search tool below to find specific information within the annual report.-
 1
1 -
2
-
3
-
4
-
5
-
6
-
7
-
8
-
9
-
10
-
11
-
12
-
13
-
14
-
15
-
16
-
17
-
18
-
19
-
20
-
21
-
22
-
23
-
24
-
25
-
26
-
27
-
28
-
 29
29 -
 30
30 -
 31
31 -
 32
32 -
 33
33 -
 34
34 -
 35
35 -
 36
36 -
 37
37 -
 38
38 -
 39
39 -
 40
40 -
 41
41 -
 42
42 -
 43
43 -
 44
44 -
 45
45 -
 46
46 -
 47
47 -
 48
48 -
 49
49 -
50
-
51
-
52
-
53
-
54
-
55
-
56
-
57
-
58
-
59
-
60
-
61
-
62
-
63
-
64
-
65
-
66
-
67
-
68
-
69
-
70
-
71
-
72
-
73
-
74
-
75
-
76
-
77
-
78
-
79
-
80
-
81
-
82
-
83
-
84
-
85
-
86
-
87
-
88
-
89
-
90
-
91
-
92
-
93
-
94
-
95
-
96
-
97
-
98
-
99
-
100
-
101
-
102
-
103
-
104
-
105
-
106
-
107
-
108
-
109
-
110
-
111
-
112
-
113
-
114
-
115
-
116
-
117
-
118
-
119
-
120
-
121
-
122
-
123
-
124
-
125
-
126
-
127
-
128
-
129
-
130
-
131
-
132
-
133
-
134
-
135
-
136
-
137
-
138
-
139
-
140
-
141
-
142
-
143
-
144
 |
 |

Table of Contents
The increase in EBIT for Greater China for fiscal 2009 was driven by higher revenues, which more than offset higher selling and administrative
expense. Selling and administrative expense increased, but represented a lower percentage of revenues for fiscal 2009. The increase in selling and
administrative expense during fiscal 2009 was primarily due to retail and infrastructure expansion and spending around brand events.
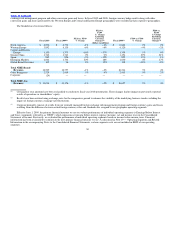
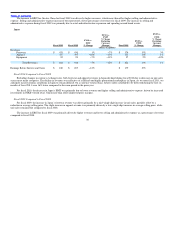
Japan
Fiscal 2010 Fiscal 2009
FY10 vs.
FY09
% Change
FY10 vs.
FY09
% Change
Excluding
Currency
Changes Fiscal 2008
FY09 vs.
FY08
% Change
FY09 vs.
FY08
% Change
Excluding
Currency
Changes
(dollars in millions)
Revenues
Footwear $ 433 $ 430 1% −7% $ 374 15% 3%
Apparel 357 397 −10% −17% 351 13% 1%
Equipment 92 99 −7% −13% 97 2% −10%
Total Revenues $ 882 $ 926 −5% −12% $ 822 13% 1%
Earnings Before Interest and Taxes $ 180 $ 205 −12% $ 179 15%
Fiscal 2010 Compared to Fiscal 2009
Excluding changes in currency exchange rates, both footwear and apparel revenues in Japan declined during fiscal 2010 due to decreases in unit sales
across most major categories. The decline in revenues was reflective of a difficult and highly promotional marketplace in Japan. As we enter fiscal 2011, we
anticipate macroeconomic conditions in Japan to remain difficult. On a currency−neutral basis, futures orders scheduled to be delivered during the first six
months of fiscal 2011 were 16% lower compared to the same period in the prior year.
For fiscal 2010, the decrease in Japan’s EBIT was primarily due to lower revenues and higher selling and administrative expense, driven by increased
investments in NIKE−owned retail, which more than offset improved gross margins.
Fiscal 2009 Compared to Fiscal 2008
For fiscal 2009, the increase in Japan’s footwear revenue was driven primarily by a mid−single digit increase in unit sales, partially offset by a
reduction in average selling price. The slight increase in apparel revenue was primarily driven by a low−single digit increase in average selling price, while
unit sales remained flat compared to fiscal 2008.
The increase in EBIT for fiscal 2009 was primarily driven by higher revenues and lower selling and administrative expense as a percentage of revenue
compared to fiscal 2008.
36