Nike 2010 Annual Report Download - page 61
Download and view the complete annual report
Please find page 61 of the 2010 Nike annual report below. You can navigate through the pages in the report by either clicking on the pages listed below, or by using the keyword search tool below to find specific information within the annual report.-
 1
1 -
2
-
3
-
4
-
5
-
6
-
7
-
8
-
9
-
10
-
11
-
12
-
13
-
14
-
15
-
16
-
17
-
18
-
19
-
20
-
21
-
22
-
23
-
24
-
25
-
26
-
27
-
28
-
29
-
30
-
31
-
32
-
33
-
34
-
35
-
36
-
37
-
38
-
39
-
40
-
41
-
42
-
43
-
44
-
45
-
46
-
47
-
48
-
49
-
50
-
 51
51 -
 52
52 -
 53
53 -
 54
54 -
 55
55 -
 56
56 -
 57
57 -
 58
58 -
 59
59 -
 60
60 -
 61
61 -
 62
62 -
 63
63 -
 64
64 -
 65
65 -
 66
66 -
 67
67 -
 68
68 -
 69
69 -
 70
70 -
 71
71 -
72
-
73
-
74
-
75
-
76
-
77
-
78
-
79
-
80
-
81
-
82
-
83
-
84
-
85
-
86
-
87
-
88
-
89
-
90
-
91
-
92
-
93
-
94
-
95
-
96
-
97
-
98
-
99
-
100
-
101
-
102
-
103
-
104
-
105
-
106
-
107
-
108
-
109
-
110
-
111
-
112
-
113
-
114
-
115
-
116
-
117
-
118
-
119
-
120
-
121
-
122
-
123
-
124
-
125
-
126
-
127
-
128
-
129
-
130
-
131
-
132
-
133
-
134
-
135
-
136
-
137
-
138
-
139
-
140
-
141
-
142
-
143
-
144
 |
 |

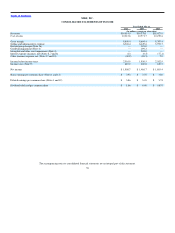
Table of Contents NIKE, INC.
CONSOLIDATED STATEMENTS OF CASH FLOWS
Year Ended May 31,
2010 2009 2008
(In millions)
Cash provided by operations:
Net income $ 1,906.7 $ 1,486.7 $ 1,883.4
Income charges (credits) not affecting cash:
Depreciation 323.7 335.0 303.6
Deferred income taxes 8.3 (294.1) (300.6)
Stock−based compensation (Note 11) 159.0 170.6 141.0
Impairment of goodwill, intangibles and other assets (Note 4) — 401.3 —
Gain on divestitures (Note 17) — — (60.6)
Amortization and other 71.8 48.3 17.9
Changes in certain working capital components and other assets and liabilities excluding the impact of
acquisition and divestitures:
Decrease (increase) in accounts receivable 181.7 (238.0) (118.3)
Decrease (increase) in inventories 284.6 32.2 (249.8)
(Increase) decrease in prepaid expenses and other current assets (69.6) 14.1 (11.2)
Increase (decrease) in accounts payable, accrued liabilities and income taxes payable 298.0 (220.0) 330.9
Cash provided by operations 3,164.2 1,736.1 1,936.3
Cash used by investing activities:
Purchases of short−term investments (3,724.4) (2,908.7) (1,865.6)
Maturities and sales of short−term investments 2,787.6 2,390.0 2,246.0
Additions to property, plant and equipment (335.1) (455.7) (449.2)
Disposals of property, plant and equipment 10.1 32.0 1.9
Increase in other assets, net of other liabilities (11.2) (47.0) (21.8)
Settlement of net investment hedges 5.5 191.3 (76.0)
Acquisition of subsidiary, net of cash acquired (Note 4) — — (571.1)
Proceeds from divestitures (Note 17) — — 246.0
Cash used by investing activities (1,267.5) (798.1) (489.8)
Cash used by financing activities:
Reductions in long−term debt, including current portion (32.2) (6.8) (35.2)
(Decrease) increase in notes payable (205.4) 177.1 63.7
Proceeds from exercise of stock options and other stock issuances 364.5 186.6 343.3
Excess tax benefits from share−based payment arrangements 58.5 25.1 63.0
Repurchase of common stock (741.2) (649.2) (1,248.0)
Dividends — common and preferred (505.4) (466.7) (412.9)
Cash used by financing activities (1,061.2) (733.9) (1,226.1)
Effect of exchange rate changes (47.5) (46.9) 56.8
Net increase in cash and equivalents 788.0 157.2 277.2
Cash and equivalents, beginning of year 2,291.1 2,133.9 1,856.7
Cash and equivalents, end of year $ 3,079.1 $ 2,291.1 $ 2,133.9
Supplemental disclosure of cash flow information:
Cash paid during the year for:
Interest, net of capitalized interest $ 48.4 $ 46.7 $ 44.1
Income taxes 537.2 765.2 717.5
Dividends declared and not paid 130.7 121.4 112.9
The accompanying notes to consolidated financial statements are an integral part of this statement.
58