Nike 2010 Annual Report Download - page 46
Download and view the complete annual report
Please find page 46 of the 2010 Nike annual report below. You can navigate through the pages in the report by either clicking on the pages listed below, or by using the keyword search tool below to find specific information within the annual report.-
 1
1 -
2
-
3
-
4
-
5
-
6
-
7
-
8
-
9
-
10
-
11
-
12
-
13
-
14
-
15
-
16
-
17
-
18
-
19
-
20
-
21
-
22
-
23
-
24
-
25
-
26
-
27
-
28
-
29
-
30
-
31
-
32
-
33
-
34
-
35
-
 36
36 -
 37
37 -
 38
38 -
 39
39 -
 40
40 -
 41
41 -
 42
42 -
 43
43 -
 44
44 -
 45
45 -
 46
46 -
 47
47 -
 48
48 -
 49
49 -
 50
50 -
 51
51 -
 52
52 -
 53
53 -
 54
54 -
 55
55 -
 56
56 -
57
-
58
-
59
-
60
-
61
-
62
-
63
-
64
-
65
-
66
-
67
-
68
-
69
-
70
-
71
-
72
-
73
-
74
-
75
-
76
-
77
-
78
-
79
-
80
-
81
-
82
-
83
-
84
-
85
-
86
-
87
-
88
-
89
-
90
-
91
-
92
-
93
-
94
-
95
-
96
-
97
-
98
-
99
-
100
-
101
-
102
-
103
-
104
-
105
-
106
-
107
-
108
-
109
-
110
-
111
-
112
-
113
-
114
-
115
-
116
-
117
-
118
-
119
-
120
-
121
-
122
-
123
-
124
-
125
-
126
-
127
-
128
-
129
-
130
-
131
-
132
-
133
-
134
-
135
-
136
-
137
-
138
-
139
-
140
-
141
-
142
-
143
-
144
 |
 |

Table of Contents
was primarily due to an increase in accounts payable and accrued liabilities, driven by timing of fourth quarter expenses, a decrease in accounts receivable
as a result of a shorter collection cycle and slightly lower revenues, and a decrease in inventories, reflective of tighter inventory buys compared to fiscal
2009.
Cash used by investing activities was $1.3 billion during fiscal 2010, compared to $0.8 billion for fiscal 2009. The year−over−year increase was
primarily due to net purchases of short−term investments of $0.9 billion (net of sales and maturities) in fiscal 2010 compared to $0.5 billion in net purchases
of short−term investments during fiscal 2009. Also contributing to the year−over−year increase in cash used by investing activities in fiscal 2010 was a
reduction in proceeds for the settlement of net investment hedges compared to the prior year period. These increases were partially offset by a reduction in
cash used for purchases of property, plant and equipment.
Cash used by financing activities was $1.1 billion for fiscal 2010 compared to $0.7 billion used in fiscal 2009. The increase in cash used by financing
activities was primarily due to an increase in payments of notes payable and long−term debt as well as an increase in share repurchases and dividends paid,
partially offset by an increase in proceeds from exercise of stock options.
In fiscal 2010, we purchased 11.3 million shares of NIKE’s Class B common stock for $754 million. During fiscal 2010, we concluded our previous
four−year, $3 billion share repurchase program that was approved by the Board of Directors in June 2006. During this program, we repurchased a total of
53.9 million shares. Having completed the program, during the third quarter of fiscal 2010, we began repurchases under the four−year $5 billion program
approved by our Board of Directors in September 2008. Of the total 11 million shares repurchased during fiscal 2010, 6.6 million shares were repurchased
under this program for $454 million. We continue to expect funding of share repurchases will come from operating cash flow, excess cash, and/or debt. The
timing and the amount of shares purchased will be dictated by our capital needs and stock market conditions.
Off−Balance Sheet Arrangements
In connection with various contracts and agreements, we provide routine indemnifications relating to the enforceability of intellectual property rights,
coverage for legal issues that arise and other items where we are acting as the guarantor. Currently, we have several such agreements in place. However,
based on our historical experience and the estimated probability of future loss, we have determined that the fair value of such indemnifications is not
material to our financial position or results of operations.
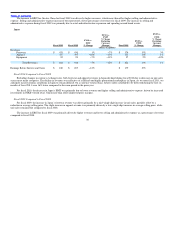
Contractual Obligations
Our significant long−term contractual obligations as of May 31, 2010, and significant endorsement contracts entered into through the date of this
report are as follows:
Cash Payments Due During the Year Ending May 31,
Description of Commitment 2011 2012 2013 2014 2015 Thereafter Total
(In millions)
Operating Leases $ 334 $ 264 $220 $177 $148 $ 466 $1,609
Long−term Debt 7 178 47 57 7 142 438
Endorsement Contracts(1) 675 638 568 508 411 990 3,790
Product Purchase Obligations(2) 2,676 — — — — — 2,676
Other(3) 267 108 114 8 3 1 501
Total $3,959 $1,188 $949 $750 $569 $ 1,599 $9,014
(1) The amounts listed for endorsement contracts represent approximate amounts of base compensation and minimum guaranteed royalty fees we are
obligated to pay athlete and sport team endorsers of our products. Actual payments under some contracts may be higher than the amounts listed as
these contracts provide for
43