Toyota 2010 Annual Report Download - page 101
Download and view the complete annual report
Please find page 101 of the 2010 Toyota annual report below. You can navigate through the pages in the report by either clicking on the pages listed below, or by using the keyword search tool below to find specific information within the annual report.-
 1
1 -
2
-
3
-
4
-
5
-
6
-
7
-
8
-
9
-
10
-
11
-
12
-
13
-
14
-
15
-
16
-
17
-
18
-
19
-
20
-
21
-
22
-
23
-
24
-
25
-
26
-
27
-
28
-
29
-
30
-
31
-
32
-
33
-
34
-
35
-
36
-
37
-
38
-
39
-
40
-
41
-
42
-
43
-
44
-
45
-
46
-
47
-
48
-
49
-
50
-
51
-
52
-
53
-
54
-
55
-
56
-
57
-
58
-
59
-
60
-
61
-
62
-
63
-
64
-
65
-
66
-
67
-
68
-
69
-
70
-
71
-
72
-
73
-
74
-
75
-
76
-
77
-
78
-
79
-
80
-
81
-
82
-
83
-
84
-
85
-
86
-
87
-
88
-
89
-
90
-
 91
91 -
 92
92 -
 93
93 -
 94
94 -
 95
95 -
 96
96 -
 97
97 -
 98
98 -
 99
99 -
 100
100 -
 101
101 -
 102
102 -
 103
103 -
 104
104 -
 105
105
 |
 |

TOYOTA ANNUAL REPORT 2010 99
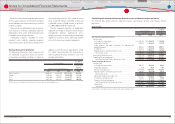
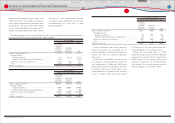
U.S. dollars in millions
For the year ended March 31, 2010
Marketable
securities
and other
securities
investments
Derivative
fi nancial
instruments Total
Balance at beginning of year ···················································································· $ 211 $ (62) $ 149
Total gains (losses)
Included in earnings ··························································································· (7) 269 262
Included in other comprehensive income (loss) ································· (1) ̶ (1)
Purchases, issuances and settlements···························································· (69) (146) (215)
Other ································································································································· 729
Balance at end of year ·································································································· $ 141 $ 63 $ 204
In the reconciliation table above, derivative
fi nancial instruments are presented net of
assets and liabilities. The other amount primarily
includes the impact of currency translation
adjustments.
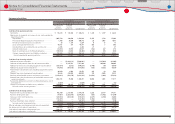
Certain assets and liabilities are measured at
fair value on a nonrecurring basis. During the
years ended March 31, 2009 and 2010, Toyota
measured certain fi nance receivables at fair value
of ¥25,932 million and ¥13,343 million ($143
million) based on the collateral value, resulting
in loss of ¥10,011 million and ¥2,485 million
($27 million). This fair value measurement on a
nonrecurring basis was classifi ed as level 3.
During the year ended March 31, 2010,
Toyota measured certain investment in affi liated
company at fair value of ¥119,821 million ($1,288
million) based on the quoted market price
resulting in impairment loss of ¥63,575 million
($683 million). This fair value measurement on a
nonrecurring basis was classifi ed as level 1.
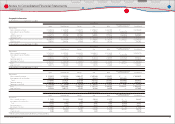
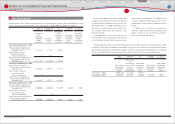
The following table summarizes the changes in Level 3 assets and liabilities measured at fair value on a
recurring basis for the periods ended March 31, 2009 and 2010:
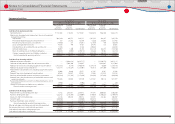
Yen in millions
For the year ended March 31, 2009
Marketable
securities
and other
securities
investments
Derivative
fi nancial
instruments Total
Balance at beginning of year ···················································································· ¥ 23,818 ¥ 25,499 ¥ 49,317
Total gains (losses)
Included in earnings ··························································································· 586 (38,538) (37,952)
Included in other comprehensive income (loss) ································· (1,398) ̶ (1,398)
Purchases, issuances and settlements···························································· (1,665) 7,026 5,361
Other ································································································································· (1,760) 279 (1,481)
Balance at end of year ·································································································· ¥ 19,581 ¥ (5,734) ¥ 13,847
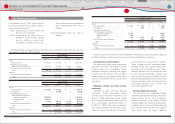
Yen in millions
For the year ended March 31, 2010
Marketable
securities
and other
securities
investments
Derivative
fi nancial
instruments Total
Balance at beginning of year ···················································································· ¥ 19,581 ¥ (5,734) ¥ 13,847
Total gains (losses)
Included in earnings ··························································································· (641) 25,057 24,416
Included in other comprehensive income (loss) ································· (99) ̶ (99)
Purchases, issuances and settlements···························································· (6,376) (13,582) (19,958)
Other ································································································································· 669 151 820
Balance at end of year ·································································································· ¥ 13,134 ¥ 5,892 ¥ 19,026
judgment to be applied. In other certain cases
when market data is not available, key inputs to
the fair value measurement include quotes from
counterparties, and other market data. Toyota
assesses the reasonableness of changes of the
quotes using observable market data. Toyotas
derivative fair value measurements consider
assumptions about counterparty and our own
non-performance risk, using such as credit
default probabilities.
Financial Section
Financial Section
Investor Information
Corporate Information
Special Feature
Consolidated
Performance Highlights
Business Overview
Top Messages
Notes to Consolidated Financial Statements