Toyota 2010 Annual Report Download - page 43
Download and view the complete annual report
Please find page 43 of the 2010 Toyota annual report below. You can navigate through the pages in the report by either clicking on the pages listed below, or by using the keyword search tool below to find specific information within the annual report.-
 1
1 -
2
-
3
-
4
-
5
-
6
-
7
-
8
-
9
-
10
-
11
-
12
-
13
-
14
-
15
-
16
-
17
-
18
-
19
-
20
-
21
-
22
-
23
-
24
-
25
-
26
-
27
-
28
-
29
-
30
-
31
-
32
-
 33
33 -
 34
34 -
 35
35 -
 36
36 -
 37
37 -
 38
38 -
 39
39 -
 40
40 -
 41
41 -
 42
42 -
 43
43 -
 44
44 -
 45
45 -
 46
46 -
 47
47 -
 48
48 -
 49
49 -
 50
50 -
 51
51 -
 52
52 -
 53
53 -
54
-
55
-
56
-
57
-
58
-
59
-
60
-
61
-
62
-
63
-
64
-
65
-
66
-
67
-
68
-
69
-
70
-
71
-
72
-
73
-
74
-
75
-
76
-
77
-
78
-
79
-
80
-
81
-
82
-
83
-
84
-
85
-
86
-
87
-
88
-
89
-
90
-
91
-
92
-
93
-
94
-
95
-
96
-
97
-
98
-
99
-
100
-
101
-
102
-
103
-
104
-
105
 |
 |

41
TOYOTA ANNUAL REPORT 2010
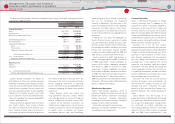
Supported by the government stimulus packages including the eco-car tax reduction and subsidy,
Toyotas domestic vehicle unit sales showed growth as compared to the prior fi scal year mainly within
the environmentally-friendly and new vehicle markets, such as Prius and SAI. However, net revenues in
Japan decreased refl ecting the decrease in the number of exported vehicles for the overseas markets.
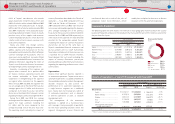
The market is recovering gradually from the downturn stemming from the fi nancial crisis since the fall
of 2008 and Toyotas vehicle unit sales in the second half of fi scal 2010 increased year-on-year primarily
due to the sales of new Sienna. However, net revenues in North America decreased primarily as a result of
the substantial decline in vehicle unit sales caused by the downturn in the market during the fi rst half of
fi scal 2010, fl uctuations in foreign currency translation rates and the eff ects of the recalls and other safety
measures.
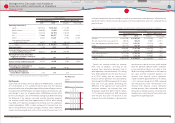
Although Toyotas vehicle unit sales in some European countries increased compared with the prior fi scal
year benefi ting from various government stimulus packages, net revenues in Europe overall decreased
primarily due to the decrease in vehicle unit sales which resulted from the downturn in the market and
fl uctuations in foreign currency translation rates.
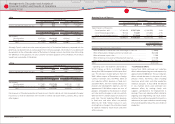
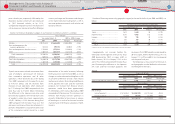
Japan
Thousands of units
Year ended March 31, 2010 vs. 2009 change
2009 2010 Amount Percentage
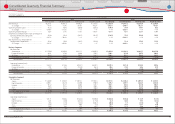
Toyotas consolidated vehicle unit sales 1,945 2,163 218 11.2%
Yen in millions
Year ended March 31, 2010 vs. 2009 change
2009 2010 Amount Percentage
Net revenues:
Sales of products······································ ¥12,067,494 ¥11,095,044 ¥(972,450) ‒8.1%
Financial services ····································· 119,243 125,259 6,016 +5.0%
Total ························································· ¥12,186,737 ¥11,220,303 ¥(966,434) ‒7.9%
North America
Thousands of units
Year ended March 31, 2010 vs. 2009 change
2009 2010 Amount Percentage
Toyotas consolidated vehicle unit sales 2,212 2,098 (114) ‒5.2%
Yen in millions
Year ended March 31, 2010 vs. 2009 change
2009 2010 Amount Percentage
Net revenues:
Sales of products······································ ¥5,226,426 ¥4,782,379 ¥(444,047) ‒8.5%
Financial services ····································· 996,488 888,147 (108,341) ‒10.9%
Total ························································· ¥6,222,914 ¥5,670,526 ¥(552,388) ‒8.9%
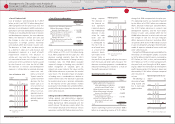
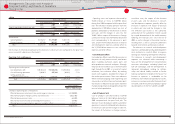
Europe
Thousands of units
Year ended March 31, 2010 vs. 2009 change
2009 2010 Amount Percentage
Toyotas consolidated vehicle unit sales 1,062 858 (204) ‒19.2%
Yen in millions
Year ended March 31, 2010 vs. 2009 change
2009 2010 Amount Percentage
Net revenues:
Sales of products······································ ¥2,911,234 ¥2,065,768 ¥(845,466) ‒29.0%
Financial services ····································· 101,894 81,281 (20,613) ‒20.2%
Total ························································· ¥3,013,128 ¥2,147,049 ¥(866,079) ‒28.7%
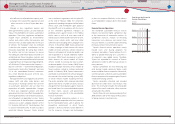
Geographically, net revenues (before the
elimination of intersegment revenues) for fi scal
2010 decreased by 7.9% in Japan, 8.9% in North
America, 28.7% in Europe, 2.4% in Asia and 11.1%
in Other compared with the prior fi scal year.
Eliminating the diff erence in the Japanese yen
value used for translation purposes, net revenues
in fi scal 2010 would have decreased by 7.9% in
Japan, 1.2% in North America, 20.1% in Europe,
7.3% in Other and would have increased by 5.5%
in Asia compared with the prior fi scal year.
The following is a discussion of net revenues in
each geographic market (before the elimination
of intersegment revenues).
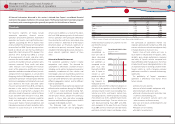
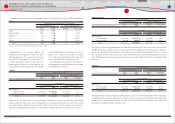
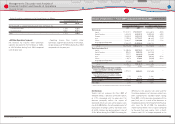
Number of fi nancing contracts by geographic region (at the end of the fi scal year 2009 and 2010) is as
follows:
Number of fi nancing contracts in thousands
Year ended March 31, 2010 vs. 2009 change
2009 2010 Amount Percentage
Japan ······································································· 1,660 1,684 24 +1.4%
North America ··················································· 4,403 4,488 85 +1.9%
Europe ···································································· 748 774 26 +3.5%
Asia ··········································································· 387 428 41 +10.6%
Other* ····································································· 440 476 36 +8.2%
Total ······························································· 7,638 7,850 212 +2.8%
* Other consists of Central and South America, Oceania and Africa.
Financial Section
Financial Section
Investor Information
Corporate Information
Special Feature
Consolidated
Performance Highlights
Business Overview
Top Messages
Management's Discussion and Analysis of
Financial Condition and Results of Operations