Toyota 2010 Annual Report Download - page 97
Download and view the complete annual report
Please find page 97 of the 2010 Toyota annual report below. You can navigate through the pages in the report by either clicking on the pages listed below, or by using the keyword search tool below to find specific information within the annual report.-
 1
1 -
2
-
3
-
4
-
5
-
6
-
7
-
8
-
9
-
10
-
11
-
12
-
13
-
14
-
15
-
16
-
17
-
18
-
19
-
20
-
21
-
22
-
23
-
24
-
25
-
26
-
27
-
28
-
29
-
30
-
31
-
32
-
33
-
34
-
35
-
36
-
37
-
38
-
39
-
40
-
41
-
42
-
43
-
44
-
45
-
46
-
47
-
48
-
49
-
50
-
51
-
52
-
53
-
54
-
55
-
56
-
57
-
58
-
59
-
60
-
61
-
62
-
63
-
64
-
65
-
66
-
67
-
68
-
69
-
70
-
71
-
72
-
73
-
74
-
75
-
76
-
77
-
78
-
79
-
80
-
81
-
82
-
83
-
84
-
85
-
86
-
 87
87 -
 88
88 -
 89
89 -
 90
90 -
 91
91 -
 92
92 -
 93
93 -
 94
94 -
 95
95 -
 96
96 -
 97
97 -
 98
98 -
 99
99 -
 100
100 -
 101
101 -
 102
102 -
 103
103 -
 104
104 -
 105
105
 |
 |
TOYOTA ANNUAL REPORT 2010 95
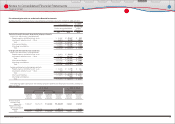
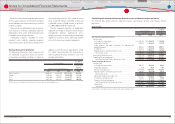
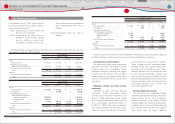
Statement of cash fl ows
Yen in millions Yen in millions
For the year ended March 31, 2008 For the year ended March 31, 2009
Non-Financial
Services
Businesses
Financial
Services
Businesses Consolidated
Non-Financial
Services
Businesses
Financial
Services
Businesses Consolidated
Cash fl ows from operating activities
Net income (loss)········································································································ ¥ 1,745,402 ¥ 50,414 ¥ 1,795,841 ¥ (394,851) ¥ (66,384) ¥ (461,215)
Adjustments to reconcile net income (loss) to net cash provided
by operating activities
Depreciation ········································································································· 1,081,410 409,725 1,491,135 1,105,233 389,937 1,495,170
Provision for doubtful accounts and credit losses ··························· 357 122,433 122,790 (1,663) 259,096 257,433
Pension and severance costs, less payments ······································ (54,868) 527 (54,341) (21,428) 470 (20,958)
Losses on disposal of fi xed assets······························································ 44,993 444 45,437 68,546 136 68,682
Unrealized losses on available-for-sale securities, net ···················· 11,346 ̶ 11,346 220,920 ̶ 220,920
Deferred income taxes ···················································································· 80,027 1,500 81,458 (132,127) (62,871) (194,990)
Equity in (earnings) losses of affi liated companies ·························· (268,025) (2,089) (270,114) (53,226) 10,502 (42,724)
Changes in operating assets and liabilities, and other ··················· (220,217) 215,218 (241,928) (223,101) 186,234 154,587
Net cash provided by operating activities ········································ 2,420,425 798,172 2,981,624 568,303 717,120 1,476,905
Cash fl ows from investing activities
Additions to fi nance receivables ······································································· ̶ (16,644,139) (8,647,717) ̶ (14,230,272) (8,612,111)
Collection of and proceeds from sales of fi nance receivables··········· ̶ 15,095,380 7,332,697 ̶ 13,959,045 8,155,094
Additions to fi xed assets excluding equipment leased to others ···· (1,472,422) (8,148) (1,480,570) (1,358,518) (6,064) (1,364,582)
Additions to equipment leased to others ····················································· (137,711) (1,141,694) (1,279,405) (82,411) (877,904) (960,315)
Proceeds from sales of fi xed assets excluding equipment leased to
others ···························································································································· 56,603 10,948 67,551 41,285 6,101 47,386
Proceeds from sales of equipment leased to others ······························ 80,944 294,937 375,881 55,896 472,853 528,749
Purchases of marketable securities and security investments ·········· (936,324) (215,316) (1,151,640) (418,342) (217,688) (636,030)
Proceeds from sales of and maturity of marketable securities and
security investments ···························································································· 789,366 198,044 987,410 1,295,561 180,316 1,475,877
Payment for additional investments in affi liated companies, net of
cash acquired ··········································································································· (4,406) ̶(4,406) (45) ̶(45)
Changes in investments and other assets, and other ···························· (44,891) 23,024 (74,687) 129,834 (2,091) 135,757
Net cash used in investing activities ···················································· (1,668,841) (2,386,964) (3,874,886) (336,740) (715,704) (1,230,220)
Cash fl ows from fi nancing activities
Proceeds from issuance of long-term debt ················································· 17,162 3,364,351 3,349,812 545,981 3,030,029 3,506,990
Payments of long-term debt ··············································································· (226,561) (2,156,709) (2,310,008) (150,097) (2,580,637) (2,704,078)
Increase in short-term borrowings ··································································· 24,126 370,293 408,912 138,387 239,462 406,507
Dividends paid ············································································································· (430,860) ̶ (430,860) (439,991) ̶ (439,991)
Purchase of common stock, and other ·························································· (311,667) ̶ (311,667) (70,587) ̶ (70,587)
Net cash provided by (used in) fi nancing activities ····················· (927,800) 1,577,935 706,189 23,693 688,854 698,841
Eff ect of exchange rate changes on cash and cash equivalents ·········· (65,405) (19,354) (84,759) (80,214) (49,579) (129,793)
Net increase (decrease) in cash and cash equivalents ······························· (241,621) (30,211) (271,832) 175,042 640,691 815,733
Cash and cash equivalents at beginning of year ·········································· 1,714,722 185,657 1,900,379 1,473,101 155,446 1,628,547
Cash and cash equivalents at end of year ························································ ¥ 1,473,101 ¥ 155,446 ¥ 1,628,547 ¥ 1,648,143 ¥ 796,137 ¥ 2,444,280
Financial Section
Financial Section
Investor Information
Corporate Information
Special Feature
Consolidated
Performance Highlights
Business Overview
Top Messages
Notes to Consolidated Financial Statements