Toyota 2010 Annual Report Download - page 48
Download and view the complete annual report
Please find page 48 of the 2010 Toyota annual report below. You can navigate through the pages in the report by either clicking on the pages listed below, or by using the keyword search tool below to find specific information within the annual report.-
 1
1 -
2
-
3
-
4
-
5
-
6
-
7
-
8
-
9
-
10
-
11
-
12
-
13
-
14
-
15
-
16
-
17
-
18
-
19
-
20
-
21
-
22
-
23
-
24
-
25
-
26
-
27
-
28
-
29
-
30
-
31
-
32
-
33
-
34
-
35
-
36
-
37
-
 38
38 -
 39
39 -
 40
40 -
 41
41 -
 42
42 -
 43
43 -
 44
44 -
 45
45 -
 46
46 -
 47
47 -
 48
48 -
 49
49 -
 50
50 -
 51
51 -
 52
52 -
 53
53 -
 54
54 -
 55
55 -
 56
56 -
 57
57 -
 58
58 -
59
-
60
-
61
-
62
-
63
-
64
-
65
-
66
-
67
-
68
-
69
-
70
-
71
-
72
-
73
-
74
-
75
-
76
-
77
-
78
-
79
-
80
-
81
-
82
-
83
-
84
-
85
-
86
-
87
-
88
-
89
-
90
-
91
-
92
-
93
-
94
-
95
-
96
-
97
-
98
-
99
-
100
-
101
-
102
-
103
-
104
-
105
 |
 |

TOYOTA ANNUAL REPORT 2010 46
Year ended March 31,
2009 2010
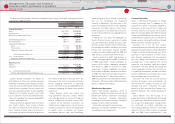
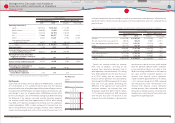
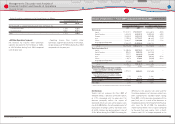
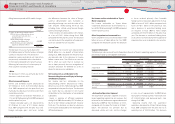
Net charge-off s as a percentage of average gross earning assets:
Finance receivables ··············································································································· 1.54% 1.15%
Operating lease ······················································································································· 0.86% 0.63%
Total ···················································································································································· 1.37% 1.03%
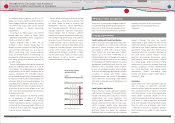
All Other Operations Segment
Net revenues for Toyotas other operations
segment decreased by ¥237.3 billion, or 20.0%,
to ¥947.6 billion during fi scal 2010 compared
with the prior year.
Operating income from Toyotas other
operations segment decreased by ¥18.8 billion,
to operating loss of ¥8.9 billion during fi scal 2010
compared with the prior year.
Ratio of credit loss experience in the United States is as follows:
Net Revenues
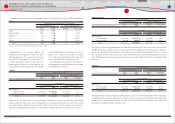
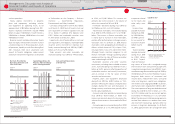
Toyota had net revenues for fi scal 2009 of
¥20,529.5 billion, a decrease of ¥5,759.7 billion,
or 21.9%, compared with the prior year. This
decrease principally refl ects the impact of
decreased vehicle unit sales and changes in sales
mix of ¥3,400.0 billion, the unfavorable impact of
fl uctuations in foreign currency translation rates
of ¥2,031.2 billion, and decreased parts sales of
¥128.6 billion during fi scal 2009. Eliminating the
diff erence in the Japanese yen value used for
translation purposes, net revenues would have
been approximately ¥22,560.7 billion during
fi scal 2009, a 14.2% decrease compared with the
prior fi scal year. As a result of the downturn in
the global economy stemming from the fi nancial
crisis since the fall of 2008, the automotive
market contracted by 15.6% in Japan compared
to the prior fi scal year, and by 15.8% in North
America and 8.2% in Europe compared to the
Yen in millions
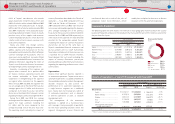
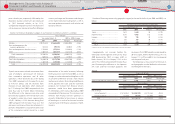
Year ended March 31, 2009 vs. 2008 change
2008 2009 Amount Percentage
Net revenues:
Japan ············································································· ¥15,315,812 ¥12,186,737 ¥(3,129,075) ‒20.4%
North America ·························································· 9,423,258 6,222,914 (3,200,344) ‒34.0%
Europe ·········································································· 3,993,434 3,013,128 (980,306) ‒24.5%
Asia ················································································· 3,120,826 2,719,329 (401,497) ‒12.9%
Other* ··········································································· 2,294,137 1,882,900 (411,237) ‒17.9%
Intersegment elimination/
unallocated amount ············································· (7,858,227) (5,495,438) 2,362,789 −
Total ·········································································· ¥26,289,240 ¥20,529,570 ¥(5,759,670) ‒21.9%
Operating income (loss):
Japan ············································································· ¥1,440,286 ¥(237,531) ¥(1,677,817) −
North America ·························································· 305,352 (390,192) (695,544) −
Europe ·········································································· 141,571 (143,233) (284,804) −
Asia ················································································· 256,356 176,060 (80,296) ‒31.3%
Other* ··········································································· 143,978 87,648 (56,330) ‒39.1%
Intersegment elimination/
unallocated amount ············································· (17,168) 46,237 63,405 −
Total ·········································································· ¥2,270,375 ¥(461,011) ¥(2,731,386) −
Operating margin ···························································· 8.6% ‒2.2% ‒10.8% −
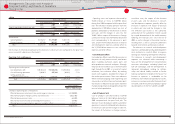
Income (loss) before income taxes, minority
interest and equity in earnings of affi liated
companies·································································· 2,437,222 (560,381) (2,997,603) −
Net margin from Income (loss) before income
taxes, minority interest and equity in earnings
of affi liated companies
············································ 9.3% ‒2.7% ‒12.0%
Equity in earnings of affi liated companies ········ 270,114 42,724 (227,390) ‒84.2%
Net income (loss) ······························································ 1,717,879 (436,937) (2,154,816) −
Net margin ··········································································· 6.5% ‒2.1% ‒8.6%
* Other consists of Central and South America, Oceania and Africa.
Results of Operations ̶ Fiscal 2009 Compared with Fiscal 2008
Financial Section
Financial Section
Investor Information
Corporate Information
Special Feature
Consolidated
Performance Highlights
Business Overview
Top Messages
Management's Discussion and Analysis of
Financial Condition and Results of Operations