Toyota 2010 Annual Report Download - page 62
Download and view the complete annual report
Please find page 62 of the 2010 Toyota annual report below. You can navigate through the pages in the report by either clicking on the pages listed below, or by using the keyword search tool below to find specific information within the annual report.-
 1
1 -
2
-
3
-
4
-
5
-
6
-
7
-
8
-
9
-
10
-
11
-
12
-
13
-
14
-
15
-
16
-
17
-
18
-
19
-
20
-
21
-
22
-
23
-
24
-
25
-
26
-
27
-
28
-
29
-
30
-
31
-
32
-
33
-
34
-
35
-
36
-
37
-
38
-
39
-
40
-
41
-
42
-
43
-
44
-
45
-
46
-
47
-
48
-
49
-
50
-
51
-
 52
52 -
 53
53 -
 54
54 -
 55
55 -
 56
56 -
 57
57 -
 58
58 -
 59
59 -
 60
60 -
 61
61 -
 62
62 -
 63
63 -
 64
64 -
 65
65 -
 66
66 -
 67
67 -
 68
68 -
 69
69 -
 70
70 -
 71
71 -
 72
72 -
73
-
74
-
75
-
76
-
77
-
78
-
79
-
80
-
81
-
82
-
83
-
84
-
85
-
86
-
87
-
88
-
89
-
90
-
91
-
92
-
93
-
94
-
95
-
96
-
97
-
98
-
99
-
100
-
101
-
102
-
103
-
104
-
105
 |
 |
TOYOTA ANNUAL REPORT 2010 60
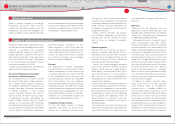
fl uctuations and to minimize interest expense.
The potential decrease in fair value resulting
from a hypothetical 100 basis point upward shift
in interest rates would be approximately ¥55.8
billion as of March 31, 2009 and ¥ 67.8 billion as
of March 31, 2010.
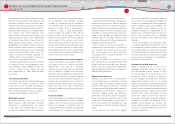
There are certain shortcomings inherent
to the sensitivity analyses presented. The
model assumes that interest rate changes
are instantaneous parallel shifts in the yield
curve. However, in reality, changes are rarely
instantaneous. Although certain assets and
liabilities may have similar maturities or periods
to repricing, they may not react correspondingly
to changes in market interest rates. Also, the
interest rates on certain types of assets and
liabilities may fl uctuate with changes in market
interest rates, while interest rates on other types
of assets may lag behind changes in market
rates. Finance receivables are less susceptible to
prepayments when interest rates change and,
as a result, Toyotas model does not address
prepayment risk for automotive related fi nance
receivables. However, in the event of a change
in interest rates, actual loan prepayments may
deviate signifi cantly from the assumptions used
in the model.
Commodity Price Risk
Commodity price risk is the possibility of higher
or lower costs due to changes in the prices of
commodities, such as non-ferrous alloys (e.g.,
aluminum), precious metals (e.g., palladium,
platinum and rhodium) and ferrous alloys, which
Toyota uses in the production of motor vehicles.
Toyota does not use derivative instruments
to hedge the price risk associated with the
purchase of those commodities and controls its
commodity price risk by holding minimum stock
levels.
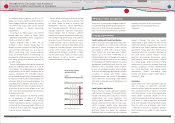
Equity Price Risk
Toyota holds investments in various available-
for-sale equity securities that are subject to price
risk. The fair value of available-for-sale equity
securities was ¥798.2 billion as of March 31,
2009 and ¥852.7 billion as of March 31, 2010.
The potential change in the fair value of these
investments, assuming a 10% change in prices,
would be approximately ¥79.8 billion as of March
31, 2009 and ¥85.3 billion as of March 31, 2010.
Financial Section
Financial Section
Investor Information
Corporate Information
Special Feature
Consolidated
Performance Highlights
Business Overview
Top Messages
Management's Discussion and Analysis of
Financial Condition and Results of Operations