Toyota 2010 Annual Report Download - page 56
Download and view the complete annual report
Please find page 56 of the 2010 Toyota annual report below. You can navigate through the pages in the report by either clicking on the pages listed below, or by using the keyword search tool below to find specific information within the annual report.-
 1
1 -
2
-
3
-
4
-
5
-
6
-
7
-
8
-
9
-
10
-
11
-
12
-
13
-
14
-
15
-
16
-
17
-
18
-
19
-
20
-
21
-
22
-
23
-
24
-
25
-
26
-
27
-
28
-
29
-
30
-
31
-
32
-
33
-
34
-
35
-
36
-
37
-
38
-
39
-
40
-
41
-
42
-
43
-
44
-
45
-
 46
46 -
 47
47 -
 48
48 -
 49
49 -
 50
50 -
 51
51 -
 52
52 -
 53
53 -
 54
54 -
 55
55 -
 56
56 -
 57
57 -
 58
58 -
 59
59 -
 60
60 -
 61
61 -
 62
62 -
 63
63 -
 64
64 -
 65
65 -
 66
66 -
67
-
68
-
69
-
70
-
71
-
72
-
73
-
74
-
75
-
76
-
77
-
78
-
79
-
80
-
81
-
82
-
83
-
84
-
85
-
86
-
87
-
88
-
89
-
90
-
91
-
92
-
93
-
94
-
95
-
96
-
97
-
98
-
99
-
100
-
101
-
102
-
103
-
104
-
105
 |
 |

54
TOYOTA ANNUAL REPORT 2010
services operations.
Toyota expects investments in property,
plant and equipment, excluding vehicles
and equipment on operating leases, to be
approximately ¥740.0 billion during fi scal 2011.
Toyotas expected investments include ¥440.0
billion in Japan, ¥120.0 billion in North America,
¥40.0 billion in Europe, ¥90.0 billion in Asia and
¥50.0 billion in Other.
Based on current available information, Toyota
does not expect environmental matters to have
a material impact on its fi nancial position, results
of operations, liquidity or cash fl ows during fi scal
2011. However, there exists uncertainty with
respect to Toyotas obligations under current
and future environment regulations as described
in Information on the Company ̶ Business
Overview ̶ Governmental Regulations,
Environmental and Safety Standards.
Cash and cash equivalents were ¥1,865.7 billion
as of March 31, 2010. Most of Toyotas cash and
cash equivalents are held in Japanese yen and
in U.S. dollars. In addition, time deposits were
¥392.7 billion and marketable securities were
¥1,793.1 billion as of March 31, 2010.
Liquid assets, which Toyota defi nes as cash and
cash equivalents, time deposits, marketable debt
securities and its investment in monetary trust
funds, increased during fi scal 2010 by ¥1,069.1
billion, or 25.3%, to ¥5,298.2 billion.
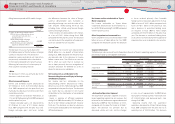
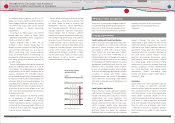
Trade accounts and notes receivable, net
increased during fi scal 2010 by ¥493.5 billion,
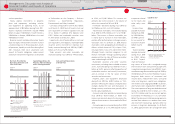
Net Cash Provided by
Operating Activities and
Free Cash Flow*
0
1,000
2,000
3,000
4,000
(¥ Billion)
7080 0960FY
Net cash provided by
operating activities
Free cash flow
*(Net cash provided by operating
activities)−(Capital expenditures
for property, plant and equipment,
excluding vehicles and equipment
on operating leases)
10
Capital Expenditures for
Property, Plant and Equip-
ment* and Depreciation
0
400
800
1,200
1,600
(¥ Billion)
7080 0960FY
Capital expenditures
Depreciation
*Excluding vehicles and equipment
on operating leases
10
Cash and Cash Equivalents
at End of Year
0
500
1,000
1,500
2,000
2,500
(¥ Billion)
7080 0960FY 10
or 35.4%, to ¥1,886.2 billion. This increase was
primarily due to the increase in the volume of
sales in the second half of fi scal 2010.
Inventories decreased during fi scal 2010 by
¥37.0 billion, or 2.5%, to ¥1,422.3 billion.
Total fi nance receivables, net increased during
fi scal 2010 by ¥293.2 billion, or 3.1%, to ¥9,840.1
billion. The increase in fi nance receivables, net
is mainly due to increase in retail receivables,
partially off set by fl uctuations in foreign currency
translation rates. As of March 31, 2010, fi nance
receivables were geographically distributed as
follows: in North America 61.9%, in Japan 12.8%,
in Europe 10.3%, in Asia 4.7% and in Other 10.3%.
Although Toyota maintains programs to sell
fi nance receivables through qualifying special
purpose entities, no sales of fi nance receivables
were made during fi scal 2010.
Marketable securities and other securities
investments, including those included in current
assets, increased during fi scal 2010 by ¥1,451.2
billion, or 55.9%, primarily refl ecting purchase of
marketable securities and security investments,
and an increase in the fair values of these
securities and investments.
Property, plant and equipment decreased
during fi scal 2010 by ¥690.7 billion, or 9.3%,
primarily refl ecting the impacts of depreciation
changes during the year and fl uctuations in
foreign currency translation rates, partially off set
by the capital expenditures.
Accounts and notes payable increased during
fi scal 2010 by ¥657.0 billion, or 50.6%. This
increase was primarily due to the increase in the
volume of transactions in the second half of fi scal
2010.
Accrued expenses increased during fi scal 2010
by ¥195.2 billion, or 12.7%, refl ecting the increase
in expenses related
to the recalls and
other safety mea-
sures.
Income taxes
payable increased
during fi scal 2010
by ¥102.0 billion,
or 199.0%, primar-
ily as a result of an
increase in income
before income
taxes.
Toyotas total bor-
rowings decreased
during fi scal 2010
by ¥105.2 billion,
or 0.8%. Toyotas
short-term borrow-
ings consist of loans with a weighted-average
interest rate of 1.55% and commercial paper with
a weighted-average interest rate of 0.44%. Short-
term borrowings decreased during fi scal 2010 by
¥338.0 billion, or 9.3%, to ¥3,279.6 billion. Toyotas
long-term debt consists of unsecured and
secured loans, medium-term notes, unsecured
notes and long-term capital lease obligations
with interest rates ranging from 0.00% to 29.25%,
and maturity dates ranging from 2010 to 2047.
The current portion of long-term debt decreased
during fi scal 2010 by ¥481.2 billion, or 17.8%,
to ¥2,218.3 billion and the non-current portion
increased by ¥714.0 billion, or 11.3%, to ¥7,015.4
billion. The decrease in total borrowings primarily
resulted from decrease in medium-term notes
and short-term borrowings, partially off set by
increase in long-term borrowings. As of March
31, 2010, approximately 36% of long-term debt
Liquid Assets*
0
1,000
2,000
3,000
4,000
5,000
(¥ Billion)
7080 0960FY
*Cash and cash equivalents, time
deposits, marketable dept
securities and investment in
monetary trust funds
10
Financial Section
Financial Section
Investor Information
Corporate Information
Special Feature
Consolidated
Performance Highlights
Business Overview
Top Messages
Management's Discussion and Analysis of
Financial Condition and Results of Operations