Toyota 2010 Annual Report Download - page 35
Download and view the complete annual report
Please find page 35 of the 2010 Toyota annual report below. You can navigate through the pages in the report by either clicking on the pages listed below, or by using the keyword search tool below to find specific information within the annual report.-
 1
1 -
2
-
3
-
4
-
5
-
6
-
7
-
8
-
9
-
10
-
11
-
12
-
13
-
14
-
15
-
16
-
17
-
18
-
19
-
20
-
21
-
22
-
23
-
24
-
 25
25 -
 26
26 -
 27
27 -
 28
28 -
 29
29 -
 30
30 -
 31
31 -
 32
32 -
 33
33 -
 34
34 -
 35
35 -
 36
36 -
 37
37 -
 38
38 -
 39
39 -
 40
40 -
 41
41 -
 42
42 -
 43
43 -
 44
44 -
 45
45 -
46
-
47
-
48
-
49
-
50
-
51
-
52
-
53
-
54
-
55
-
56
-
57
-
58
-
59
-
60
-
61
-
62
-
63
-
64
-
65
-
66
-
67
-
68
-
69
-
70
-
71
-
72
-
73
-
74
-
75
-
76
-
77
-
78
-
79
-
80
-
81
-
82
-
83
-
84
-
85
-
86
-
87
-
88
-
89
-
90
-
91
-
92
-
93
-
94
-
95
-
96
-
97
-
98
-
99
-
100
-
101
-
102
-
103
-
104
-
105
 |
 |
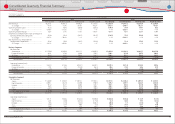
33
TOYOTA ANNUAL REPORT 2010
Yen in millions % change
2006 2007 2008 2009 2010 2010 vs. 2009
For the Year:
Net Revenues:
Sales of Products ················································································· ¥ 20,059,493 ¥ 22,670,097 ¥ 24,820,510 ¥ 19,173,720 ¥ 17,724,729 ‒7.6
Financing Operations ······································································· 977,416 1,277,994 1,468,730 1,355,850 1,226,244 ‒9.6
Total ······································································································· ¥ 21,036,909 ¥ 23,948,091 ¥ 26,289,240 ¥ 20,529,570 ¥ 18,950,973 ‒7.7
Costs and Expenses:
Cost of Products Sold ········································································ ¥ 16,335,312 ¥ 18,356,255 ¥ 20,452,338 ¥ 17,468,416 ¥ 15,971,496 ‒8.6
Cost of Financing Operations ······················································· 609,632 872,138 1,068,015 987,384 712,301 ‒27.9
Selling, General and Administrative ·········································· 2,213,623 2,481,015 2,498,512 2,534,781 2,119,660 ‒16.4
Total ······································································································· ¥ 19,158,567 ¥ 21,709,408 ¥ 24,018,865 ¥ 20,990,581 ¥ 18,803,457 ‒10.4
Operating Income (Loss) ······································································ ¥ 1,878,342 ¥ 2,238,683 ¥ 2,270,375 ¥ (461,011) ¥ 147,516 ̶
% of Net Revenues ············································································· 8.9% 9.3% 8.6% ‒2.2% 0.8% ̶
Income (Loss) before Income Taxes and Equity in
Earnings of Affi liated Companies ················································ 2,087,360 2,382,516 2,437,222 (560,381) 291,468 ̶
Provision for Income Taxes ·································································· 795,153 898,312 911,495 (56,442) 92,664 ̶
Net Income (Loss) attributable to Toyota Motor Corporation
· · 1,372,180 1,644,032 1,717,879 (436,937) 209,456 ̶
ROE ···················································································································· 14.0% 14.7% 14.5% ‒4.0% 2.1% ̶
Net Cash Provided by Operating Activities ································· ¥ 2,515,480 ¥ 3,238,173 ¥ 2,981,624 ¥ 1,476,905 ¥ 2,558,530 +73.2
Net Cash Used in Investing Activities ············································· (3,375,500) (3,814,378) (3,874,886) (1,230,220) (2,850,184) ̶
Net Cash Provided by (Used in) Financing Activities ············· 876,911 881,768 706,189 698,841 (277,982) ̶
R&D Expenses ······························································································ 812,648 890,782 958,882 904,075 725,345 ‒19.8
Capital Expenditures for Property, Plant and Equipment* · 1,523,459 1,425,814 1,480,570 1,364,582 604,536 ‒55.7
Depreciation ································································································ 1,211,178 1,382,594 1,491,135 1,495,170 1,414,569 ‒5.4
At Year-End:
Toyota Motor Corporation
Shareholders Equity ······················ ¥ 10,560,449 ¥ 11,836,092 ¥ 11,869,527 ¥ 10,061,207 ¥ 10,359,723 +3.0
Total Assets ··································································································· 28,731,595 32,574,779 32,458,320 29,062,037 30,349,287 +4.4
Long-Term Debt ························································································ 5,640,490 6,263,585 5,981,931 6,301,469 7,015,409 +11.3
Cash and Cash Equivalents ·································································· 1,569,387 1,900,379 1,628,547 2,444,280 1,865,746 ‒23.7
Ratio of
Toyota Motor Corporation
Shareholders Equity····· 36.8% 36.3% 36.6% 34.6% 34.1% ̶
Yen % change
2006 2007 2008 2009 2010 2010 vs. 2009
Per Share Data:
Net Income (Loss) attributable to
Toyota Motor Corporation (Basic) ·············································· ¥ 421.76 ¥ 512.09 ¥ 540.65 ¥ (139.13) ¥ 66.79 ̶
Annual Cash Dividends ·········································································· 90 120 140 100 45 ‒55.0
Toyota Motor Corporation
Shareholders Equity ······················ 3,257.63 3,701.17 3,768.97 3,208.41 3,303.49 +3.0
Stock Information (March 31):
Stock Price ····································································································· ¥6,430 ¥7,550 ¥4,970 ¥3,120 ¥3,745 +20.0
Market Capitalization (Yen in millions) ·········································· ¥23,212,284 ¥27,255,481 ¥17,136,548 ¥10,757,752 ¥12,912,751 +20.0
Number of Shares Issued (shares) ··················································· 3,609,997,492 3,609,997,492 3,447,997,492 3,447,997,492 3,447,997,492 ̶
* Excluding vehicles and equipment of operating leases
Financial Section
Financial Section
Investor Information
Corporate Information
Special Feature
Consolidated
Performance Highlights
Business Overview
Top Messages
Selected Financial Summary (U.S. GAAP)
Toyota Motor Corporation
Fiscal years ended March 31