Toyota 2010 Annual Report Download - page 54
Download and view the complete annual report
Please find page 54 of the 2010 Toyota annual report below. You can navigate through the pages in the report by either clicking on the pages listed below, or by using the keyword search tool below to find specific information within the annual report.-
 1
1 -
2
-
3
-
4
-
5
-
6
-
7
-
8
-
9
-
10
-
11
-
12
-
13
-
14
-
15
-
16
-
17
-
18
-
19
-
20
-
21
-
22
-
23
-
24
-
25
-
26
-
27
-
28
-
29
-
30
-
31
-
32
-
33
-
34
-
35
-
36
-
37
-
38
-
39
-
40
-
41
-
42
-
43
-
 44
44 -
 45
45 -
 46
46 -
 47
47 -
 48
48 -
 49
49 -
 50
50 -
 51
51 -
 52
52 -
 53
53 -
 54
54 -
 55
55 -
 56
56 -
 57
57 -
 58
58 -
 59
59 -
 60
60 -
 61
61 -
 62
62 -
 63
63 -
 64
64 -
65
-
66
-
67
-
68
-
69
-
70
-
71
-
72
-
73
-
74
-
75
-
76
-
77
-
78
-
79
-
80
-
81
-
82
-
83
-
84
-
85
-
86
-
87
-
88
-
89
-
90
-
91
-
92
-
93
-
94
-
95
-
96
-
97
-
98
-
99
-
100
-
101
-
102
-
103
-
104
-
105
 |
 |

52
TOYOTA ANNUAL REPORT 2010
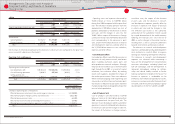
was primarily due to the decrease in vehicle unit
sales and changes in sales mix of ¥1,300.0 billion,
the increase in expenses of ¥491.3 billion, and
the decrease in parts sales, partially off set by the
decrease in research and development expenses.
The decrease in vehicle unit sales and changes
in sales mix refl ected such factors as a substantial
contraction of the automotive market caused
by a rapid deterioration of the world economy
following the fi nancial crisis since the fall of
2008, as well as changes in the market structure
resulting from a shift in consumer preference
towards small vehicles and low-price vehicles.
The increase in expenses is attributable to the
ineffi ciency from decreased operational activity,
increase in inventory reserve for the lower of cost
or market, and the incurrence of product-quality
related expenses in the fi rst half of fi scal 2009.
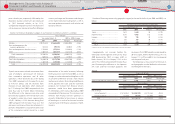
Financial Services Operations Segment
Net revenues for the fi nancial services operations
decreased during fi scal 2009 by ¥120.8 billion,
or 8.1%, compared to the prior fi scal year to
¥1,377.5 billion. This decrease was primarily
due to the unfavorable impact of fl uctuations
in foreign currency translation rates of ¥195.0
billion, which was partially off set by a higher
volume of fi nancing of ¥95.0 billion. Eliminating
the diff erence in the Japanese yen value used
for translation purposes, net revenues for its
fi nancial services operations would have been
approximately ¥1,572.5 billion during fi scal 2009,
a 5.0% increase compared with the prior fi scal
year. The increase in net revenues from fi nancial
services operations, eliminating the diff erence
in the Japanese yen value used for translation
purposes, is primarily attributable to the increase
in volume of fi nancings as a result of an increase
in market share primarily of the fi nance subsidiary
in North America.
Operating income from fi nancial services
operations decreased by ¥158.5 billion to an
operating loss of ¥72.0 billion during fi scal 2009
compared with the prior fi scal year. This decrease
was primarily due to the ¥170.0 billion increase
in provision for credit losses, net charge-off s and
the ¥70.0 billion increase in provision for residual
value losses, and the ¥12.2 billion increase in
valuation losses on interest rate swaps stated at
fair value in sales fi nance subsidiaries primarily in
the United States.
The increase in provision for credit losses,
net charge-off s is primarily attributable to the
increase in provision for credit losses and net
charge-off s in the United States due to the rise
in the ratio of credit losses as a result of the
economic downturn.
The increase in provision for residual value
losses is primarily attributable to the decrease in
the prices of used vehicles, particularly of large
vehicles with low fuel economy, as a result of the
economic downturn. The increase in valuation
losses on interest rate swaps stated at fair value is
attributable to the valuation losses on fl oating to
fi xed interest rate swaps that are not designated
as hedges due to the decline in market interest
rates.
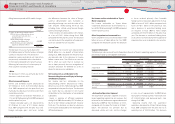
All Other Operations Segment
Net revenues for Toyotas other operations
segment decreased by ¥162.0 billion, or 12.0%,
to ¥1,184.9 billion during fi scal 2009 compared
with the prior fi scal year.
Operating income from Toyotas other
operations segment decreased by ¥23.1 billion,
or 70.0%, to ¥9.9 billion during fi scal 2009
compared with the prior fi scal year.
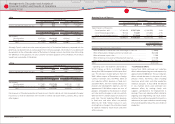
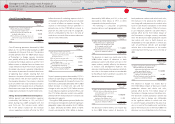
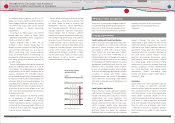
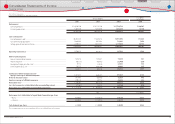
Ratio of credit loss experience in the United States is as follows:
Year ended March 31,
2008 2009
Net charge-off s as a percentage of average gross earning assets:
Finance receivables ··································································································· 1.08% 1.54%
Operating lease ··········································································································· 0.40% 0.86%
Total 0.91% 1.37%
Financial Section
Financial Section
Investor Information
Corporate Information
Special Feature
Consolidated
Performance Highlights
Business Overview
Top Messages
Management's Discussion and Analysis of
Financial Condition and Results of Operations