Toyota 2010 Annual Report Download - page 67
Download and view the complete annual report
Please find page 67 of the 2010 Toyota annual report below. You can navigate through the pages in the report by either clicking on the pages listed below, or by using the keyword search tool below to find specific information within the annual report.-
 1
1 -
2
-
3
-
4
-
5
-
6
-
7
-
8
-
9
-
10
-
11
-
12
-
13
-
14
-
15
-
16
-
17
-
18
-
19
-
20
-
21
-
22
-
23
-
24
-
25
-
26
-
27
-
28
-
29
-
30
-
31
-
32
-
33
-
34
-
35
-
36
-
37
-
38
-
39
-
40
-
41
-
42
-
43
-
44
-
45
-
46
-
47
-
48
-
49
-
50
-
51
-
52
-
53
-
54
-
55
-
56
-
 57
57 -
 58
58 -
 59
59 -
 60
60 -
 61
61 -
 62
62 -
 63
63 -
 64
64 -
 65
65 -
 66
66 -
 67
67 -
 68
68 -
 69
69 -
 70
70 -
 71
71 -
 72
72 -
 73
73 -
 74
74 -
 75
75 -
 76
76 -
 77
77 -
78
-
79
-
80
-
81
-
82
-
83
-
84
-
85
-
86
-
87
-
88
-
89
-
90
-
91
-
92
-
93
-
94
-
95
-
96
-
97
-
98
-
99
-
100
-
101
-
102
-
103
-
104
-
105
 |
 |
65
TOYOTA ANNUAL REPORT 2010
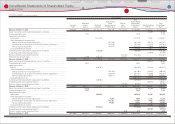
Yen in millions U.S. dollars
in millions
2008 2009 2010 2010
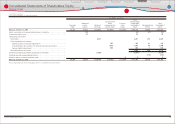
Cash fl ows from investing activities
Additions to fi nance receivables ······································ ¥ (8,647,717) ¥ (8,612,111) ¥ (7,806,201) $ (83,902)
Collection of fi nance receivables ······································ 7,223,573 8,143,804 7,509,578 80,714
Proceeds from sale of fi nance receivables ·················· 109,124 11,290 8,390 90
Additions to fi xed assets excluding equipment
leased to others ····································································· (1,480,570) (1,364,582) (604,536) (6,498)
Additions to equipment leased to others ···················· (1,279,405) (960,315) (833,065) (8,954)
Proceeds from sales of fi xed assets
excluding equipment leased to others ···················· 67,551 47,386 52,473 564
Proceeds from sales of equipment leased to
others ·························································································· 375,881 528,749 465,092 4,999
Purchases of marketable securities and security
investments ············································································· (1,151,640) (636,030) (2,412,182) (25,926)
Proceeds from sales of marketable securities
and security investments ················································· 165,495 800,422 77,025 828
Proceeds upon maturity of marketable
securities and security investments ··························· 821,915 675,455 1,031,716 11,089
Payment for additional investments in affi liated
companies,net of cash acquired ·································· (4,406) (45) (1,020) (11)
Changes in investments and other assets,
and other ·················································································· (74,687) 135,757 (337,454) (3,627)
Net cash used in investing activities ····················· ¥ (3,874,886) ¥ (1,230,220) ¥ (2,850,184) $ (30,634)
Cash fl ows from fi nancing activities
Proceeds from issuance of long-term debt ················ ¥ 3,349,812 ¥ 3,506,990 ¥ 3,178,310 $ 34,161
Payments of long-term debt ·············································· (2,310,008) (2,704,078) (2,938,202) (31,580)
Increase (decrease) in short-term borrowings ·········· 408,912 406,507 (335,363) (3,605)
Dividends paid ············································································ (430,860) (439,991) (172,476) (1,854)
Purchase of common stock, and other ························· (311,667) (70,587) (10,251) (110)
Net cash provided by (used in) fi nancing
activities ············································································ 706,189 698,841 (277,982) (2,988)
Eff ect of exchange rate changes on cash and
cash equivalents ···········································································
(84,759) (129,793) (8,898) (95)
Net increase (decrease) in cash and cash equivalents (271,832) 815,733 (578,534) (6,218)
Cash and cash equivalents at beginning of year ·········· 1,900,379 1,628,547 2,444,280 26,271
Cash and cash equivalents at end of year ························ ¥ 1,628,547 ¥ 2,444,280 ¥ 1,865,746 $ 20,053
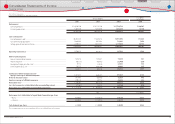
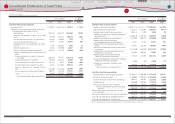
Yen in millions U.S. dollars
in millions
2008 2009 2010 2010
Cash fl ows from operating activities
Net income (loss)········································································· ¥ 1,795,841 ¥ (461,215) ¥ 244,212 $ 2,625
Adjustments to reconcile net income (loss) to net
cash provided by operating activities
Depreciation ········································································ 1,491,135 1,495,170 1,414,569 15,204
Provision for doubtful accounts and credit
losses ························································································ 122,790 257,433 100,775 1,083
Pension and severance costs, less payments ····· (54,341) (20,958) 1,254 13
Losses on disposal of fi xed assets····························· 45,437 68,682 46,937 505
Unrealized losses on available-for-sale securi-
ties, net ···················································································· 11,346 220,920 2,486 27
Deferred income taxes ··················································· 81,458 (194,990) 25,537 274
Equity in earnings of affi liated companies ·········· (270,114) (42,724) (45,408) (488)
Changes in operating assets and liabilities, and
other
(Increase) decrease in accounts and notes
receivable ···································································· (206,793) 791,481 (576,711) (6,199)
(Increase) decrease in inventories ······················· (149,984) 192,379 56,059 603
(Increase) decrease in other current assets ···· (82,737) 9,923 97,494 1,048
Increase (decrease) in accounts payable ········· 62,241 (837,402) 649,214 6,978
Increase (decrease) in accrued income
taxes ···················································································· (118,030) (251,868) 102,207 1,098
Increase (decrease) in other current liabilities
··· 206,911 (41,819) 213,341 2,293
Other ··················································································· 46,464 291,893 226,564 2,435
Net cash provided by operating activities · ¥ 2,981,624 ¥ 1,476,905 ¥ 2,558,530 $ 27,499
The accompanying notes are an integral part of these consolidated fi nancial statements.
Financial Section
Financial Section
Investor Information
Corporate Information
Special Feature
Consolidated
Performance Highlights
Business Overview
Top Messages
Consolidated Statements of Cash Flows
Toyota Motor Corporation
For the years ended March 31, 2008, 2009 and 2010