Toyota 2010 Annual Report Download - page 94
Download and view the complete annual report
Please find page 94 of the 2010 Toyota annual report below. You can navigate through the pages in the report by either clicking on the pages listed below, or by using the keyword search tool below to find specific information within the annual report.-
 1
1 -
2
-
3
-
4
-
5
-
6
-
7
-
8
-
9
-
10
-
11
-
12
-
13
-
14
-
15
-
16
-
17
-
18
-
19
-
20
-
21
-
22
-
23
-
24
-
25
-
26
-
27
-
28
-
29
-
30
-
31
-
32
-
33
-
34
-
35
-
36
-
37
-
38
-
39
-
40
-
41
-
42
-
43
-
44
-
45
-
46
-
47
-
48
-
49
-
50
-
51
-
52
-
53
-
54
-
55
-
56
-
57
-
58
-
59
-
60
-
61
-
62
-
63
-
64
-
65
-
66
-
67
-
68
-
69
-
70
-
71
-
72
-
73
-
74
-
75
-
76
-
77
-
78
-
79
-
80
-
81
-
82
-
83
-
 84
84 -
 85
85 -
 86
86 -
 87
87 -
 88
88 -
 89
89 -
 90
90 -
 91
91 -
 92
92 -
 93
93 -
 94
94 -
 95
95 -
 96
96 -
 97
97 -
 98
98 -
 99
99 -
 100
100 -
 101
101 -
 102
102 -
 103
103 -
 104
104 -
105
 |
 |

TOYOTA ANNUAL REPORT 2010 92
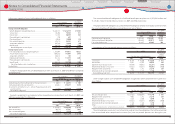
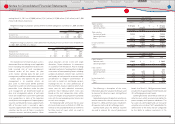
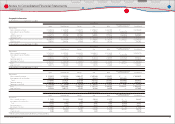
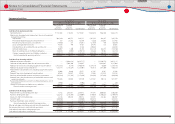
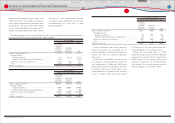
Geographic information
As of and for the year ended March 31, 2008:
Yen in millions
Japan North America Europe Asia Other Inter-segment Elimination/
Unallocated Amount Consolidated
Net revenues
Sales to external customers ··························································· ¥ 8,418,620 ¥ 9,248,950 ¥ 3,802,814 ¥ 2,790,987 ¥ 2,027,869 ¥ ̶ ¥ 26,289,240
Inter-segment sales and transfers ··············································· 6,897,192 174,308 190,620 329,839 266,268 (7,858,227) ̶
Total ········································································································ 15,315,812 9,423,258 3,993,434 3,120,826 2,294,137 (7,858,227) 26,289,240
Operating expenses ··········································································· 13,875,526 9,117,906 3,851,863 2,864,470 2,150,159 (7,841,059) 24,018,865
Operating income ··············································································· ¥ 1,440,286 ¥ 305,352 ¥ 141,571 ¥ 256,356 ¥ 143,978 ¥ (17,168) ¥ 2,270,375
Assets ········································································································· ¥ 12,883,255 ¥ 10,779,947 ¥ 3,125,572 ¥ 1,792,681 ¥ 1,703,533 ¥ 2,173,332 ¥ 32,458,320
Long-lived assets ················································································· 3,696,081 2,808,782 574,854 446,513 285,772 ̶ 7,812,002
As of and for the year ended March 31, 2009:
Yen in millions
Japan North America Europe Asia Other Inter-segment Elimination/
Unallocated Amount Consolidated
Net revenues
Sales to external customers ··························································· ¥ 7,471,916 ¥ 6,097,676 ¥ 2,889,753 ¥ 2,450,412 ¥ 1,619,813 ¥ ̶ ¥ 20,529,570
Inter-segment sales and transfers ··············································· 4,714,821 125,238 123,375 268,917 263,087 (5,495,438) ̶
Total ········································································································ 12,186,737 6,222,914 3,013,128 2,719,329 1,882,900 (5,495,438) 20,529,570
Operating expenses ··········································································· 12,424,268 6,613,106 3,156,361 2,543,269 1,795,252 (5,541,675) 20,990,581
Operating income (loss) ··································································· ¥ (237,531) ¥ (390,192) ¥ (143,233) ¥ 176,060 ¥ 87,648 ¥ 46,237 ¥ (461,011)
Assets ········································································································· ¥ 11,956,431 ¥ 10,685,466 ¥ 2,324,528 ¥ 1,547,890 ¥ 1,446,505 ¥ 1,101,217 ¥ 29,062,037
Long-lived assets ················································································· 3,658,719 2,726,419 410,185 372,330 234,028 ̶ 7,401,681
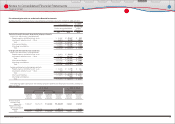
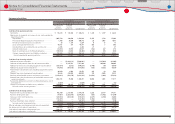
As of and for the year ended March 31, 2010:
Yen in millions
Japan North America Europe Asia Other Inter-segment Elimination/
Unallocated Amount Consolidated
Net revenues
Sales to external customers ·························································· ¥ 7,314,813 ¥ 5,583,228 ¥ 2,082,671 ¥ 2,431,648 ¥ 1,538,613 ¥ ̶ ¥ 18,950,973
Inter-segment sales and transfers ·············································· 3,905,490 87,298 64,378 223,679 135,248 (4,416,093) ̶
Total ······································································································· 11,220,303 5,670,526 2,147,049 2,655,327 1,673,861 (4,416,093) 18,950,973
Operating expenses ·········································································· 11,445,545 5,585,036 2,180,004 2,451,800 1,558,287 (4,417,215) 18,803,457
Operating income (loss) ·································································· ¥ (225,242) ¥ 85,490 ¥ (32,955) ¥ 203,527 ¥ 115,574 ¥ 1,122 ¥ 147,516
Assets ········································································································ ¥ 12,465,677 ¥ 10,223,903 ¥ 2,060,962 ¥ 1,925,126 ¥ 1,803,703 ¥ 1,869,916 ¥ 30,349,287
Long-lived assets ················································································ 3,347,896 2,401,172 351,037 361,296 249,500 ̶ 6,710,901
U.S. dollars in millions
Japan North America Europe Asia Other Inter-segment Elimination/
Unallocated Amount Consolidated
Net revenues
Sales to external customers ···································································· $ 78,620 $ 60,009 $ 22,385 $ 26,136 $ 16,537 $ ̶ $ 203,687
Inter-segment sales and transfers ······················································· 41,976 938 692 2,404 1,454 (47,464) ̶
Total ················································································································ 120,596 60,947 23,077 28,540 17,991 (47,464) 203,687
Operating expenses ···················································································· 123,017 60,028 23,431 26,352 16,749 (47,476) 202,101
Operating income (loss) ··········································································· $ (2,421) $ 919 $ (354) $ 2,188 $ 1,242 $ 12 $ 1,586
Assets ·················································································································· $ 133,982 $ 109,887 $ 22,151 $ 20,692 $ 19,386 $ 20,098 $ 326,196
Long-lived assets ·························································································· 35,983 25,808 3,773 3,883 2,682 ̶ 72,129
* Other consists of Central and South America, Oceania and Africa.
Financial Section
Financial Section
Investor Information
Corporate Information
Special Feature
Consolidated
Performance Highlights
Business Overview
Top Messages
Notes to Consolidated Financial Statements