Toyota 2010 Annual Report Download - page 53
Download and view the complete annual report
Please find page 53 of the 2010 Toyota annual report below. You can navigate through the pages in the report by either clicking on the pages listed below, or by using the keyword search tool below to find specific information within the annual report.-
 1
1 -
2
-
3
-
4
-
5
-
6
-
7
-
8
-
9
-
10
-
11
-
12
-
13
-
14
-
15
-
16
-
17
-
18
-
19
-
20
-
21
-
22
-
23
-
24
-
25
-
26
-
27
-
28
-
29
-
30
-
31
-
32
-
33
-
34
-
35
-
36
-
37
-
38
-
39
-
40
-
41
-
42
-
 43
43 -
 44
44 -
 45
45 -
 46
46 -
 47
47 -
 48
48 -
 49
49 -
 50
50 -
 51
51 -
 52
52 -
 53
53 -
 54
54 -
 55
55 -
 56
56 -
 57
57 -
 58
58 -
 59
59 -
 60
60 -
 61
61 -
 62
62 -
 63
63 -
64
-
65
-
66
-
67
-
68
-
69
-
70
-
71
-
72
-
73
-
74
-
75
-
76
-
77
-
78
-
79
-
80
-
81
-
82
-
83
-
84
-
85
-
86
-
87
-
88
-
89
-
90
-
91
-
92
-
93
-
94
-
95
-
96
-
97
-
98
-
99
-
100
-
101
-
102
-
103
-
104
-
105
 |
 |

51
TOYOTA ANNUAL REPORT 2010
falling between periods of full model changes.
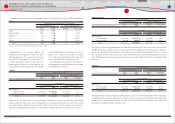
Asia
Yen in millions
2009 vs. 2008
change
Changes in operating income and loss:
Eff ect of decrease in production volume
and vehicle unit sales and other
operational factors ········································
¥ ‒
Eff ect of fl uctuation in foreign
currency translation rates ················· (24,400)
Eff ect of increase in cost reduction,
expenses and other eff ects ············· (55,896)
Total ········································································ ¥ (80,296)
The decrease in Asia was mainly due to the
¥24.4 billion impact of the fl uctuations in foreign
currency translation rates. The decrease in
production volume and vehicle unit sales in Asia
was primarily attributable to the sales decline
in the market compared to the prior fi scal year
following the fi nancial crisis in the majority of
Asian countries including Thailand.
Other
The decrease in Other was primarily due to the
decrease in vehicle unit sales.
Other Income and Expenses
Interest and dividend income decreased by
¥27.3 billion, or 16.4%, to ¥138.4 billion during
fi scal 2009 compared with the prior fi scal year
mainly due to a decrease in interest income from
marketable securities.
Interest expense increased by ¥0.8 billion, or
1.7%, to ¥46.9 billion during fi scal 2009 compared
with the prior fi scal year.
Foreign exchange gains, net decreased by
¥11.0 billion to a loss of ¥1.8 billion during
fi scal 2009 compared with the prior fi scal year.
Foreign exchange gains and losses include
the diff erences between the value of foreign
currency denominated sales translated at
prevailing exchange rates and the value of the
sales amounts settled during the fi scal year,
including those settled using forward foreign
currency exchange contracts.
Other income, net decreased by ¥227.2 billion
to a loss of ¥189.1 billion during fi scal 2009
compared with the prior fi scal year. This decrease
was mainly due to the recognition of impairment
losses on available-for sale securities.
Income Taxes
The provision for income taxes decreased by
¥968.0 billion to a tax benefi t of ¥56.5 billion
during fi scal 2009 compared with the prior fi scal
year primarily due to the decrease in income
before income taxes. The eff ective tax rate was
10.1%, which was lower than its statutory tax
rate in Japan primarily due to a recognition of
valuation allowance for deferred tax assets at
domestic and overseas subsidiaries.
Net Income and Loss attributable to the
Noncontrolling Interest and Equity in Earnings
of Affi liated Companies
Net income and loss attributable to the
noncontrolling interest decreased by ¥102.2
billion to a loss of ¥24.2 billion during fi scal 2009
compared with the prior fi scal year. This decrease
was mainly due to a decrease in net income
attributable to the shareholders of consolidated
subsidiaries.
Equity in earnings of affi liated companies
during fi scal 2009 decreased by ¥227.4 billion, or
84.2%, to ¥42.7 billion compared with the prior
fi scal year. This decrease was due to a decrease
in net income attributable to the shareholders of
affi liated companies.
Net Income and Loss attributable to Toyota
Motor Corporation
Net income attributable to Toyota Motor
Corporation decreased by ¥2,154.8 billion to a
loss of ¥437.0 billion during fi scal 2009 compared
with the prior fi scal year.
Other Comprehensive Income and Loss
Other comprehensive losses decreased by ¥76.0
billion to losses of ¥866.5 billion for fi scal 2009
compared with the prior fi scal year. This decrease
in losses resulted primarily from favorable
foreign currency translation adjustments in fi scal
2009 to losses of ¥381.3 billion compared with
losses of ¥461.1 billion in the prior fi scal year,
and a decrease in unrealized holding losses
on securities in fi scal 2009 to ¥293.1 billion
compared with ¥347.8 billion in the prior fi scal
year. The decrease in unrealized holding losses
on securities was mainly due to the recognition of
impairment losses on available-for sale securities.
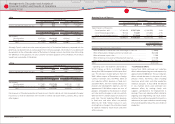
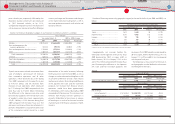
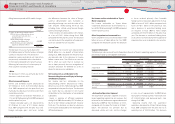
Segment Information
The following is a discussion of results of operations for each of Toyotas operating segments. The amounts
presented are prior to intersegment elimination.
Yen in millions
Year ended March 31, 2009 vs. 2008 change
2008 2009 Amount Percentage
Automotive:
Net revenues ·························
¥ 24,177,306 ¥ 18,564,723 ¥ (5,612,583) ‒23.2%
Operating income (loss) ··
2,171,905 (394,876) (2,566,781) ‒
Financial Services:
Net revenues ·························
¥ 1,498,354 ¥ 1,377,548 ¥ (120,806) ‒8.1%
Operating income (loss) ··
86,494 (71,947) (158,441) ‒
All Other:
Net revenues ·························
¥ 1,346,955 ¥ 1,184,947 ¥ (162,008) ‒12.0%
Operating income (loss) ··
33,080 9,913 (23,167) ‒70.0%
Intersegment
elimination/unallocated
amount:
Net revenues ·························
¥ (733,375) ¥ (597,648) ¥ 135,727 ‒
Operating income (loss) ··
(21,104) (4,101) 17,003 ‒
Automotive Operations Segment
The automotive operations segment is Toyotas
largest operating segment by net revenues. Net
revenues for the automotive segment decreased
during fi scal 2009 by ¥5,612.6 billion, or 23.2%,
compared with the prior fi scal year to ¥18,564.7
billion. The decrease was primarily due to
decreased vehicle unit sales and the changes
in sales mix of approximately ¥3,400.0 billion,
fl uctuations in foreign currency translation rates
of ¥1,833.8 billion and decreased parts sales
during fi scal 2009.
Operating income from the automotive
operations decreased by ¥2,566.7 billion during
fi scal 2009 compared with the prior year to an
operating loss of ¥394.8 billion. This decrease
Financial Section
Financial Section
Investor Information
Corporate Information
Special Feature
Consolidated
Performance Highlights
Business Overview
Top Messages
Management's Discussion and Analysis of
Financial Condition and Results of Operations