Toyota 2010 Annual Report Download - page 93
Download and view the complete annual report
Please find page 93 of the 2010 Toyota annual report below. You can navigate through the pages in the report by either clicking on the pages listed below, or by using the keyword search tool below to find specific information within the annual report.-
 1
1 -
2
-
3
-
4
-
5
-
6
-
7
-
8
-
9
-
10
-
11
-
12
-
13
-
14
-
15
-
16
-
17
-
18
-
19
-
20
-
21
-
22
-
23
-
24
-
25
-
26
-
27
-
28
-
29
-
30
-
31
-
32
-
33
-
34
-
35
-
36
-
37
-
38
-
39
-
40
-
41
-
42
-
43
-
44
-
45
-
46
-
47
-
48
-
49
-
50
-
51
-
52
-
53
-
54
-
55
-
56
-
57
-
58
-
59
-
60
-
61
-
62
-
63
-
64
-
65
-
66
-
67
-
68
-
69
-
70
-
71
-
72
-
73
-
74
-
75
-
76
-
77
-
78
-
79
-
80
-
81
-
82
-
 83
83 -
 84
84 -
 85
85 -
 86
86 -
 87
87 -
 88
88 -
 89
89 -
 90
90 -
 91
91 -
 92
92 -
 93
93 -
 94
94 -
 95
95 -
 96
96 -
 97
97 -
 98
98 -
 99
99 -
 100
100 -
 101
101 -
 102
102 -
 103
103 -
104
-
105
 |
 |

TOYOTA ANNUAL REPORT 2010 91
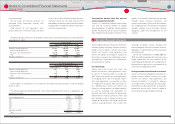
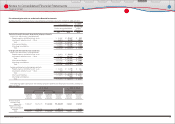
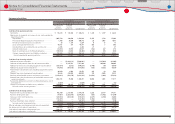
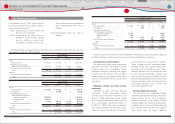
As of and for the year ended March 31, 2010:
Yen in millions
Automotive
Financial
Services All Other
Inter-segment
Elimination/
Unallocated
Amount Consolidated
Net revenues
Sales to external customers ··· ¥ 17,187,308 ¥ 1,226,244 ¥ 537,421 ¥ ̶ ¥ 18,950,973
Inter-segment sales and
transfers ············································ 10,120 19,163 410,194 (439,477) ̶
Total ················································ 17,197,428 1,245,407 947,615 (439,477) 18,950,973
Operating expenses ··················· 17,283,798 998,480 956,475 (435,296) 18,803,457
Operating income (loss) ·········· ¥ (86,370) ¥ 246,927 ¥ (8,860) ¥ (4,181) ¥ 147,516
Assets ················································· ¥ 12,359,404 ¥ 13,274,953 ¥ 1,119,635 ¥ 3,595,295 ¥ 30,349,287
Investment in equity
method investees ··················· 1,692,702 129,745 ̶ 44,993 1,867,440
Depreciation expenses············· 1,018,935 348,820 46,814 ̶ 1,414,569
Capital expenditure ··················· 616,216 774,102 21,751 25,532 1,437,601
U.S. dollars in millions
Automotive
Financial
Services All Other
Inter-segment
Elimination/
Unallocated
Amount Consolidated
Net revenues
Sales to external customers ··· $ 184,730 $ 13,180 $ 5,777 $ ̶ $ 203,687
Inter-segment sales and
transfers ··········································· 109 206 4,409 (4,724) ̶
Total ················································ 184,839 13,386 10,186 (4,724) 203,687
Operating expenses ··················· 185,767 10,732 10,281 (4,679) 202,101
Operating income (loss) ·········· $ (928) $ 2,654 $ (95) $ (45) $ 1,586
Assets ················································· $ 132,840 $ 142,680 $ 12,034 $ 38,642 $ 326,196
Investment in equity
method investees ··················· 18,193 1,394 ̶ 484 20,071
Depreciation expenses············· 10,952 3,749 503 ̶ 15,204
Capital expenditure ··················· 6,623 8,320 234 275 15,452
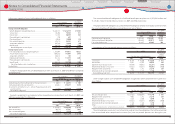
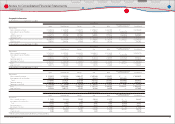
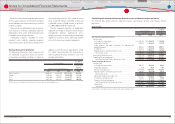
Segment operating results and assets
As of and for the year ended March 31, 2008:
Yen in millions
Automotive
Financial
Services All Other
Inter-segment
Elimination/
Unallocated
Amount Consolidated
Net revenues
Sales to external customers ··· ¥ 24,160,254 ¥ 1,468,730 ¥ 660,256 ¥ ̶ ¥ 26,289,240
Inter-segment sales and
transfers ············································ 17,052 29,624 686,699 (733,375) ̶
Total ················································ 24,177,306 1,498,354 1,346,955 (733,375) 26,289,240
Operating expenses ··················· 22,005,401 1,411,860 1,313,875 (712,271) 24,018,865
Operating income ······················ ¥ 2,171,905 ¥ 86,494 ¥ 33,080 ¥ (21,104) ¥ 2,270,375
Assets ················································· ¥ 13,593,025 ¥ 13,942,372 ¥ 1,273,560 ¥ 3,649,363 ¥ 32,458,320
Investment in equity
method investees ··················· 1,777,956 235,166 ̶ 52,656 2,065,778
Depreciation expenses············· 1,050,541 409,725 30,869 ̶ 1,491,135
Capital expenditure ··················· 1,546,524 1,149,842 56,439 7,170 2,759,975
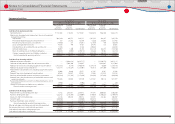
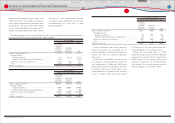
As of and for the year ended March 31, 2009:
Yen in millions
Automotive
Financial
Services All Other
Inter-segment
Elimination/
Unallocated
Amount Consolidated
Net revenues
Sales to external customers ··· ¥ 18,550,501 ¥ 1,355,850 ¥ 623,219 ¥ ̶ ¥ 20,529,570
Inter-segment sales and
transfers ········································ 14,222 21,698 561,728 (597,648) ̶
Total ················································ 18,564,723 1,377,548 1,184,947 (597,648) 20,529,570
Operating expenses ··················· 18,959,599 1,449,495 1,175,034 (593,547) 20,990,581
Operating income (loss) ·········· ¥ (394,876) ¥ (71,947) ¥ 9,913 ¥ (4,101) ¥ (461,011)
Assets ················································· ¥ 11,716,316 ¥ 13,631,662 ¥ 1,131,400 ¥ 2,582,659 ¥ 29,062,037
Investment in equity
method investees ··················· 1,606,013 168,057 ̶ 36,036 1,810,106
Depreciation expenses············· 1,072,848 389,937 32,385 ̶ 1,495,170
Capital expenditure ··················· 1,343,572 883,968 35,334 62,023 2,324,897
Financial Section
Financial Section
Investor Information
Corporate Information
Special Feature
Consolidated
Performance Highlights
Business Overview
Top Messages
Notes to Consolidated Financial Statements