Toyota 2010 Annual Report Download - page 73
Download and view the complete annual report
Please find page 73 of the 2010 Toyota annual report below. You can navigate through the pages in the report by either clicking on the pages listed below, or by using the keyword search tool below to find specific information within the annual report.-
 1
1 -
2
-
3
-
4
-
5
-
6
-
7
-
8
-
9
-
10
-
11
-
12
-
13
-
14
-
15
-
16
-
17
-
18
-
19
-
20
-
21
-
22
-
23
-
24
-
25
-
26
-
27
-
28
-
29
-
30
-
31
-
32
-
33
-
34
-
35
-
36
-
37
-
38
-
39
-
40
-
41
-
42
-
43
-
44
-
45
-
46
-
47
-
48
-
49
-
50
-
51
-
52
-
53
-
54
-
55
-
56
-
57
-
58
-
59
-
60
-
61
-
62
-
 63
63 -
 64
64 -
 65
65 -
 66
66 -
 67
67 -
 68
68 -
 69
69 -
 70
70 -
 71
71 -
 72
72 -
 73
73 -
 74
74 -
 75
75 -
 76
76 -
 77
77 -
 78
78 -
 79
79 -
 80
80 -
 81
81 -
 82
82 -
 83
83 -
84
-
85
-
86
-
87
-
88
-
89
-
90
-
91
-
92
-
93
-
94
-
95
-
96
-
97
-
98
-
99
-
100
-
101
-
102
-
103
-
104
-
105
 |
 |
TOYOTA ANNUAL REPORT 2010 71
As of March 31, 2010, government bonds
include 76% of Japanese government bonds, and
24% of U.S. and European government bonds. As
of March 31, 2010, listed stocks on the Japanese
stock markets represent 88% of common stocks
which are included in available-for-sale. Other
includes primarily commercial paper.
Unrealized losses continuing over a 12 month
period or more in the aggregate were not
material at March 31, 2009 and 2010.
As of March 31, 2009 and 2010, maturities
of government bonds and other included in
available-for-sale are mainly from 1 to 10 years.
Proceeds from sales of available-for-sale
securities were ¥165,495 million, ¥800,422
million and ¥77,025 million ($828 million) for
the years ended March 31, 2008, 2009 and 2010,
respectively. On those sales, gross realized gains
were ¥18,766 million, ¥35,694 million and ¥3,186
million ($34 million) and gross realized losses
were ¥21 million, ¥1,856 million and ¥7 million
($0 million), respectively.
During the years ended March 31, 2008,
2009 and 2010, Toyota recognized impairment
losses on available-for-sale securities of ¥11,346
million, ¥220,920 million and ¥2,486 million
($27 million), respectively, which are included in
Other income (loss), net in the accompanying
consolidated statements of income. Impairment
losses recognized during the year ended
March 31, 2009 primarily include a loss for an
other-than-temporary impairment on a certain
investment for which Toyota previously recorded
an exchange gain.
In the ordinary course of business, Toyota
maintains long-term investment securities,
included in Marketable securities and other
securities investments and issued by a number
of non-public companies which are recorded at
cost, as their fair values were not readily
determinable. Management employs a systematic
methodology to assess the recoverability of such
investments by reviewing the fi nancial viability
of the underlying companies and the prevailing
market conditions in which these companies
operate to determine if Toyotas investment in
each individual company is impaired and
whether the impairment is other-than-temporary.
Toyota periodically performs this impairment
test for signifi cant investments recorded at cost.
If the impairment is determined to be other-
than-temporary, the carrying value of the
investment is written-down by the impaired
amount and the losses are recognized currently
in operations.
Retail receivables
Toyota acquires new and used vehicle installment
contracts primarily from dealers. Contract period
of these primarily range from 2 years to 7 years.
Installment contracts acquired must fi rst meet
specifi ed credit standards. Thereafter, Toyota
retains responsibility for contract collection and
administration. Toyota acquires security interests
in the vehicles fi nanced and can generally
repossess vehicles if customers fail to meet
their contractual obligations. Almost all retail
receivables are non-recourse, which relieves the
dealers from fi nancial responsibility in the event
of repossession.
Finance lease receivables
Toyota acquires new vehicle lease contracts
originated primarily through dealers. Contract
period of these primarily range from 2 years
to 5 years. Lease contracts acquired must fi rst
meet specifi ed credit standards after which
Toyota assumes ownership of the leased vehicle.
Toyota is responsible for contract collection and
administration during the lease period. Toyota
is generally permitted to take possession of the
vehicle upon a default by the lessee. The residual
value is estimated at the time the vehicle is fi rst
leased. Vehicles returned to Toyota at the end of
their leases are sold by auction.
Wholesale and other dealer loan receivables
Toyota provides wholesale fi nancing to
qualifi ed dealers to fi nance inventories. Toyota
acquires security interests in vehicles fi nanced
at wholesale. In cases where additional security
interests would be required, Toyota takes
dealership assets or personal assets, or both, as
additional security. If a dealer defaults, Toyota
has the right to liquidate any assets acquired
and seek legal remedies. Toyota also makes
term loans to dealers for business acquisitions,
facilities refurbishment, real estate purchases
and working capital requirements. These loans
are typically secured with liens on real estate,
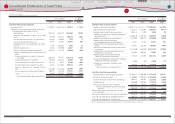
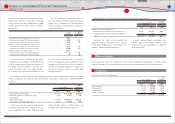
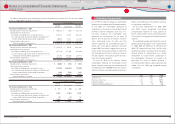
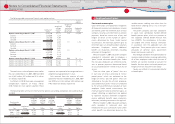
Finance receivables consist of the following:
Yen in millions
U.S. dollars
in millions
March 31, March 31,
2009 2010 2010
Retail···························································································································· ¥ 6,655,404 ¥ 6,810,144 $ 73,196
Finance leases ········································································································ 1,108,408 1,232,508 13,247
Wholesale and other dealer loans······························································· 2,322,721 2,403,239 25,830
10,086,533 10,445,891 112,273
Deferred origination costs ··············································································· 104,521 109,747 1,180
Unearned income ································································································ (405,171) (482,983) (5,191)
Allowance for credit losses
Retail ························································································································ (157,359) (148,503) (1,596)
Finance leases ···································································································· (7,776) (36,917) (397)
Wholesale and other dealer loans ··························································· (73,797) (47,059) (506)
(238,932) (232,479) (2,499)
Total fi nance receivables, net ································································ 9,546,951 9,840,176 105,763
Less ‒ Current portion ······················································································· (3,891,406) (4,209,496) (45,244)
Noncurrent fi nance receivables, net ·················································· ¥ 5,655,545 ¥ 5,630,680 $ 60,519
Financial Section
Special Feature
Top Messages
Notes to Consolidated Financial Statements
Financial Section
Investor Information
Corporate Information
Consolidated
Performance Highlights
Business Overview
Finance receivables:
7